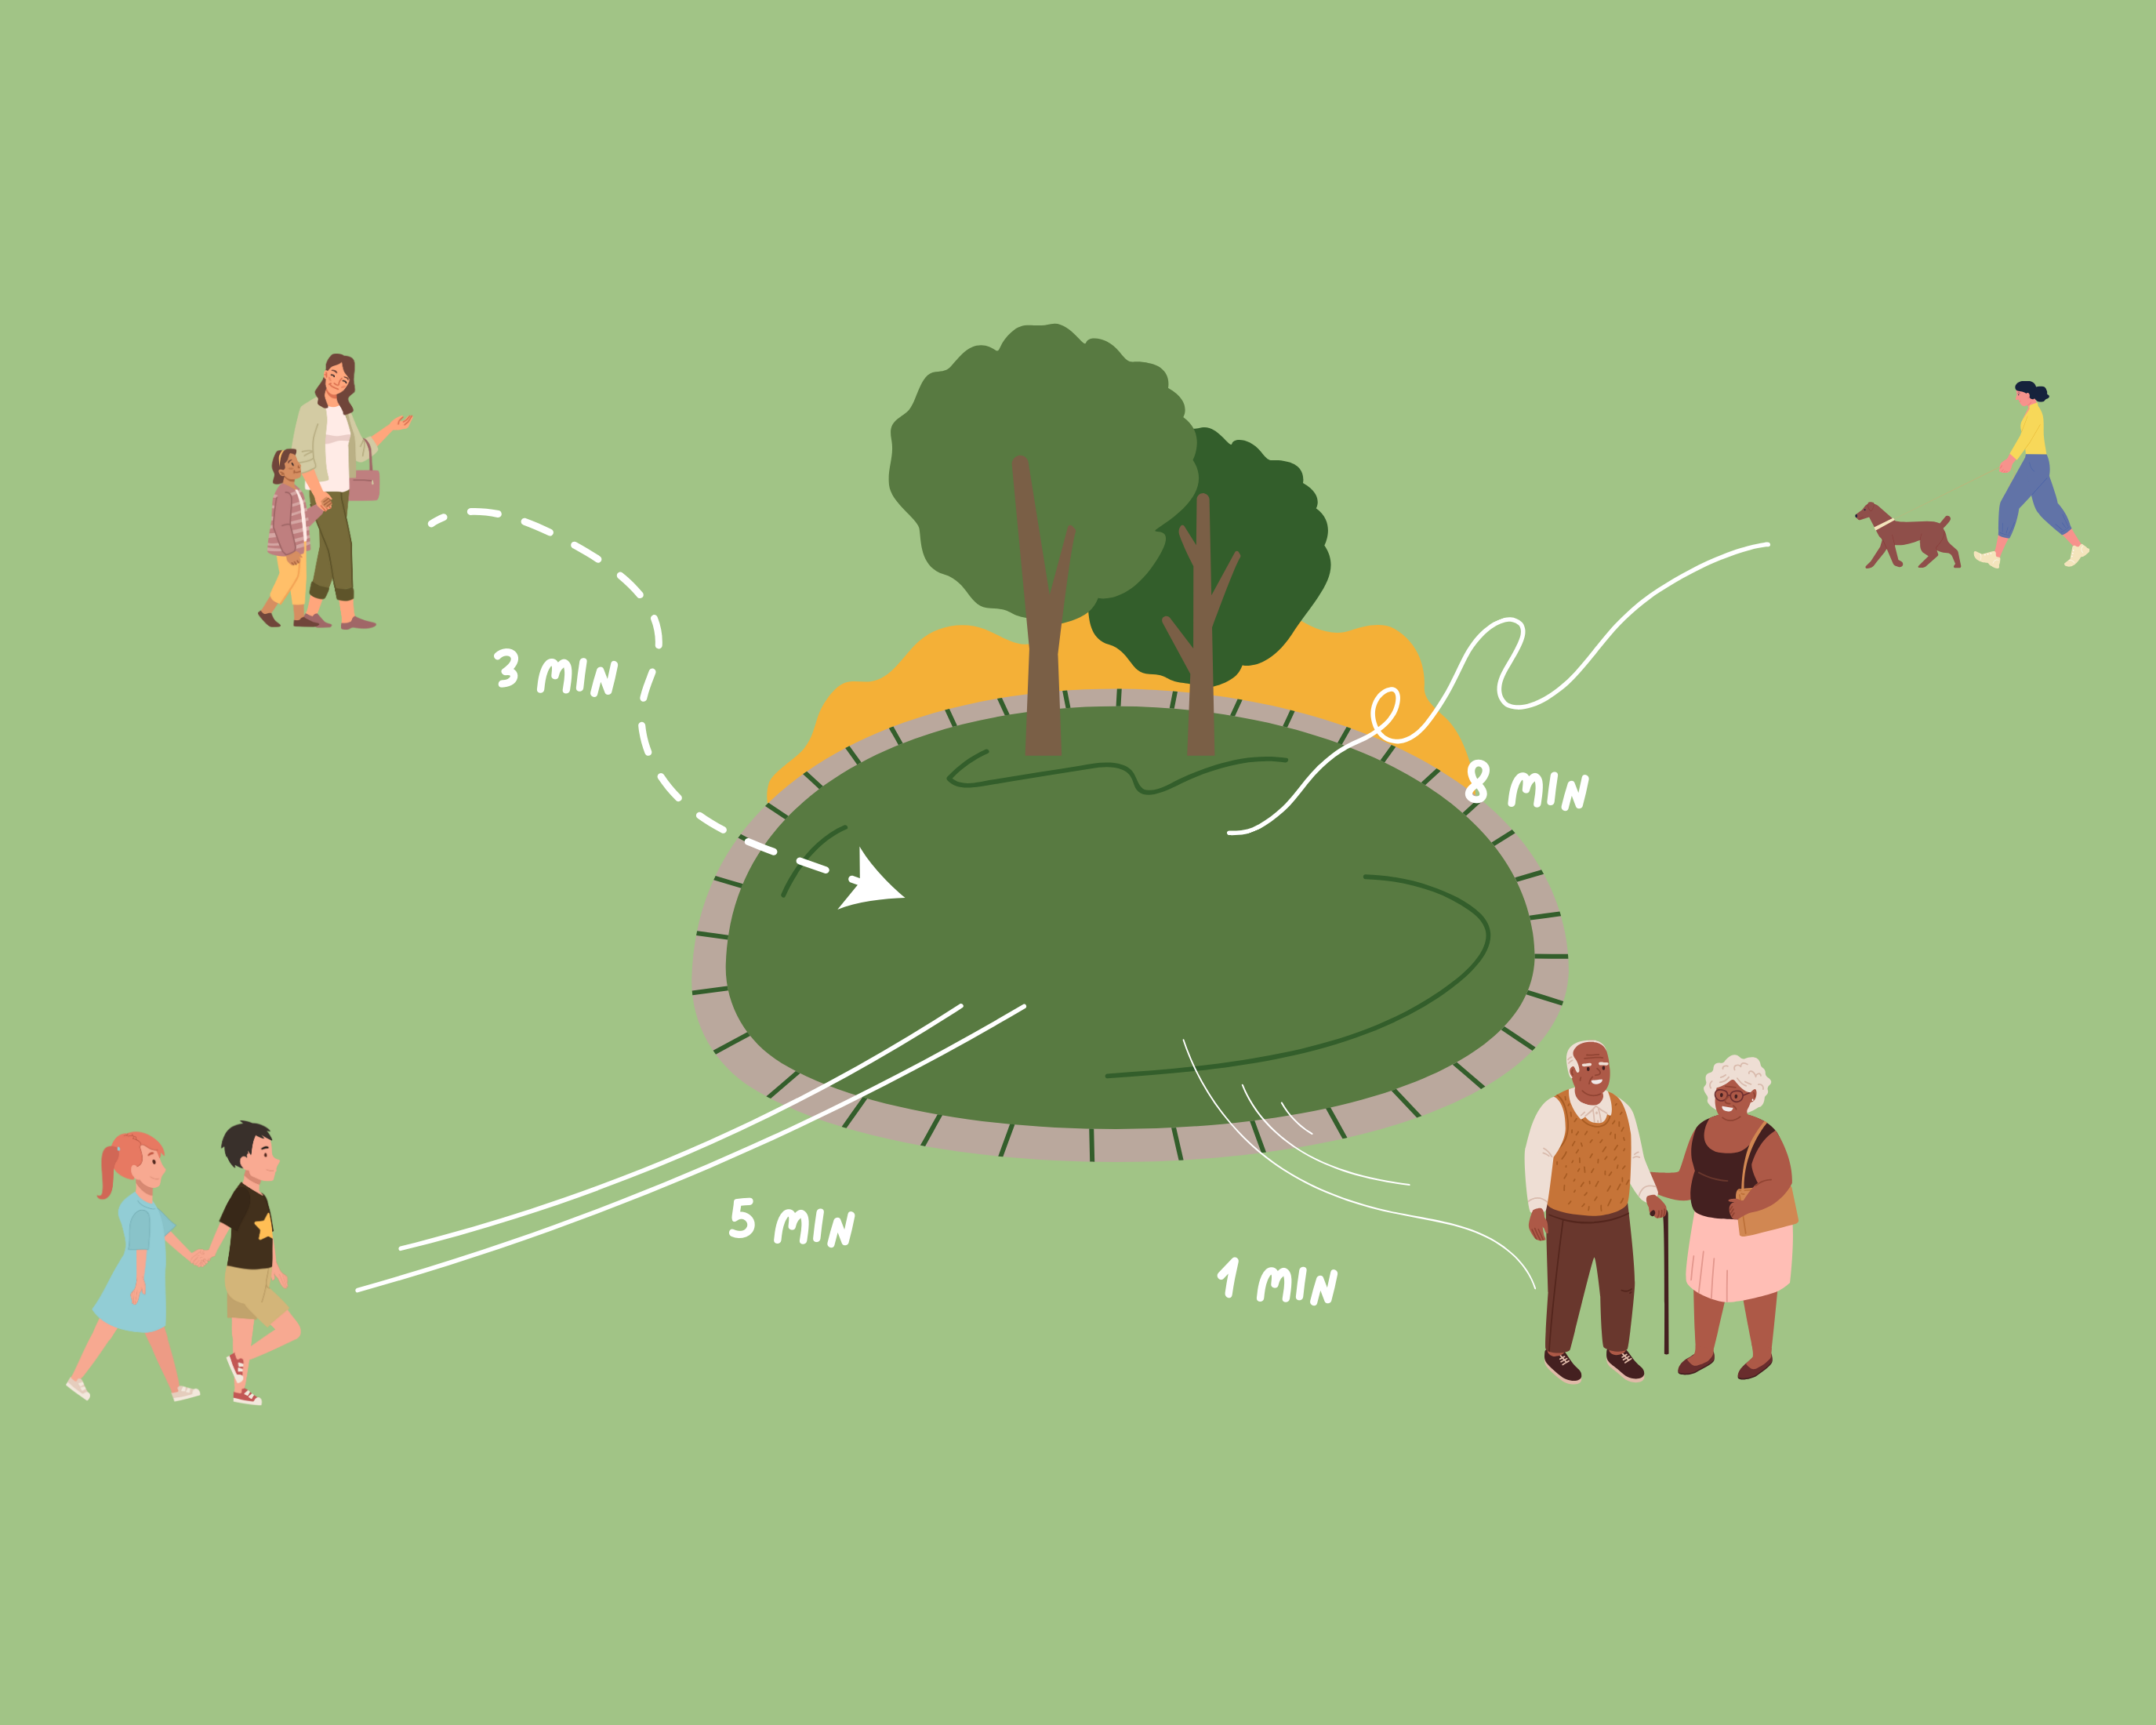

CTwalk Map is an interactive web tool that seeks to highlight
the
social cohesion potential of neighbourhoods while unmasking local
access. Utilizing population,
location, and pedestrian network data from open sources, it
estimates the number of individuals from
different age groups who can reach city destinations within a 5 or
15-minute walk, highlighting
opportunities for social cohesion and access inequities.
Transparency is a key feature of CTwalk Map. It openly
acknowledges
limitations in the available data, encouraging further data
collection and refinement. Users navigate
the map through a user-friendly interface and explore different
destinations. They are encouraged to
identify anomalies in the map and scrutinize the completeness of the
used data sources.
Furthermore, it serves an educational purpose by enhancing public
understanding of the relationship
between AI, urban design, accessibility, and social cohesion. It
simplifies complex concepts and
provides in-depth insights into how street networks shape
accessibility, empowering citizens to actively
participate in urban planning discussions.
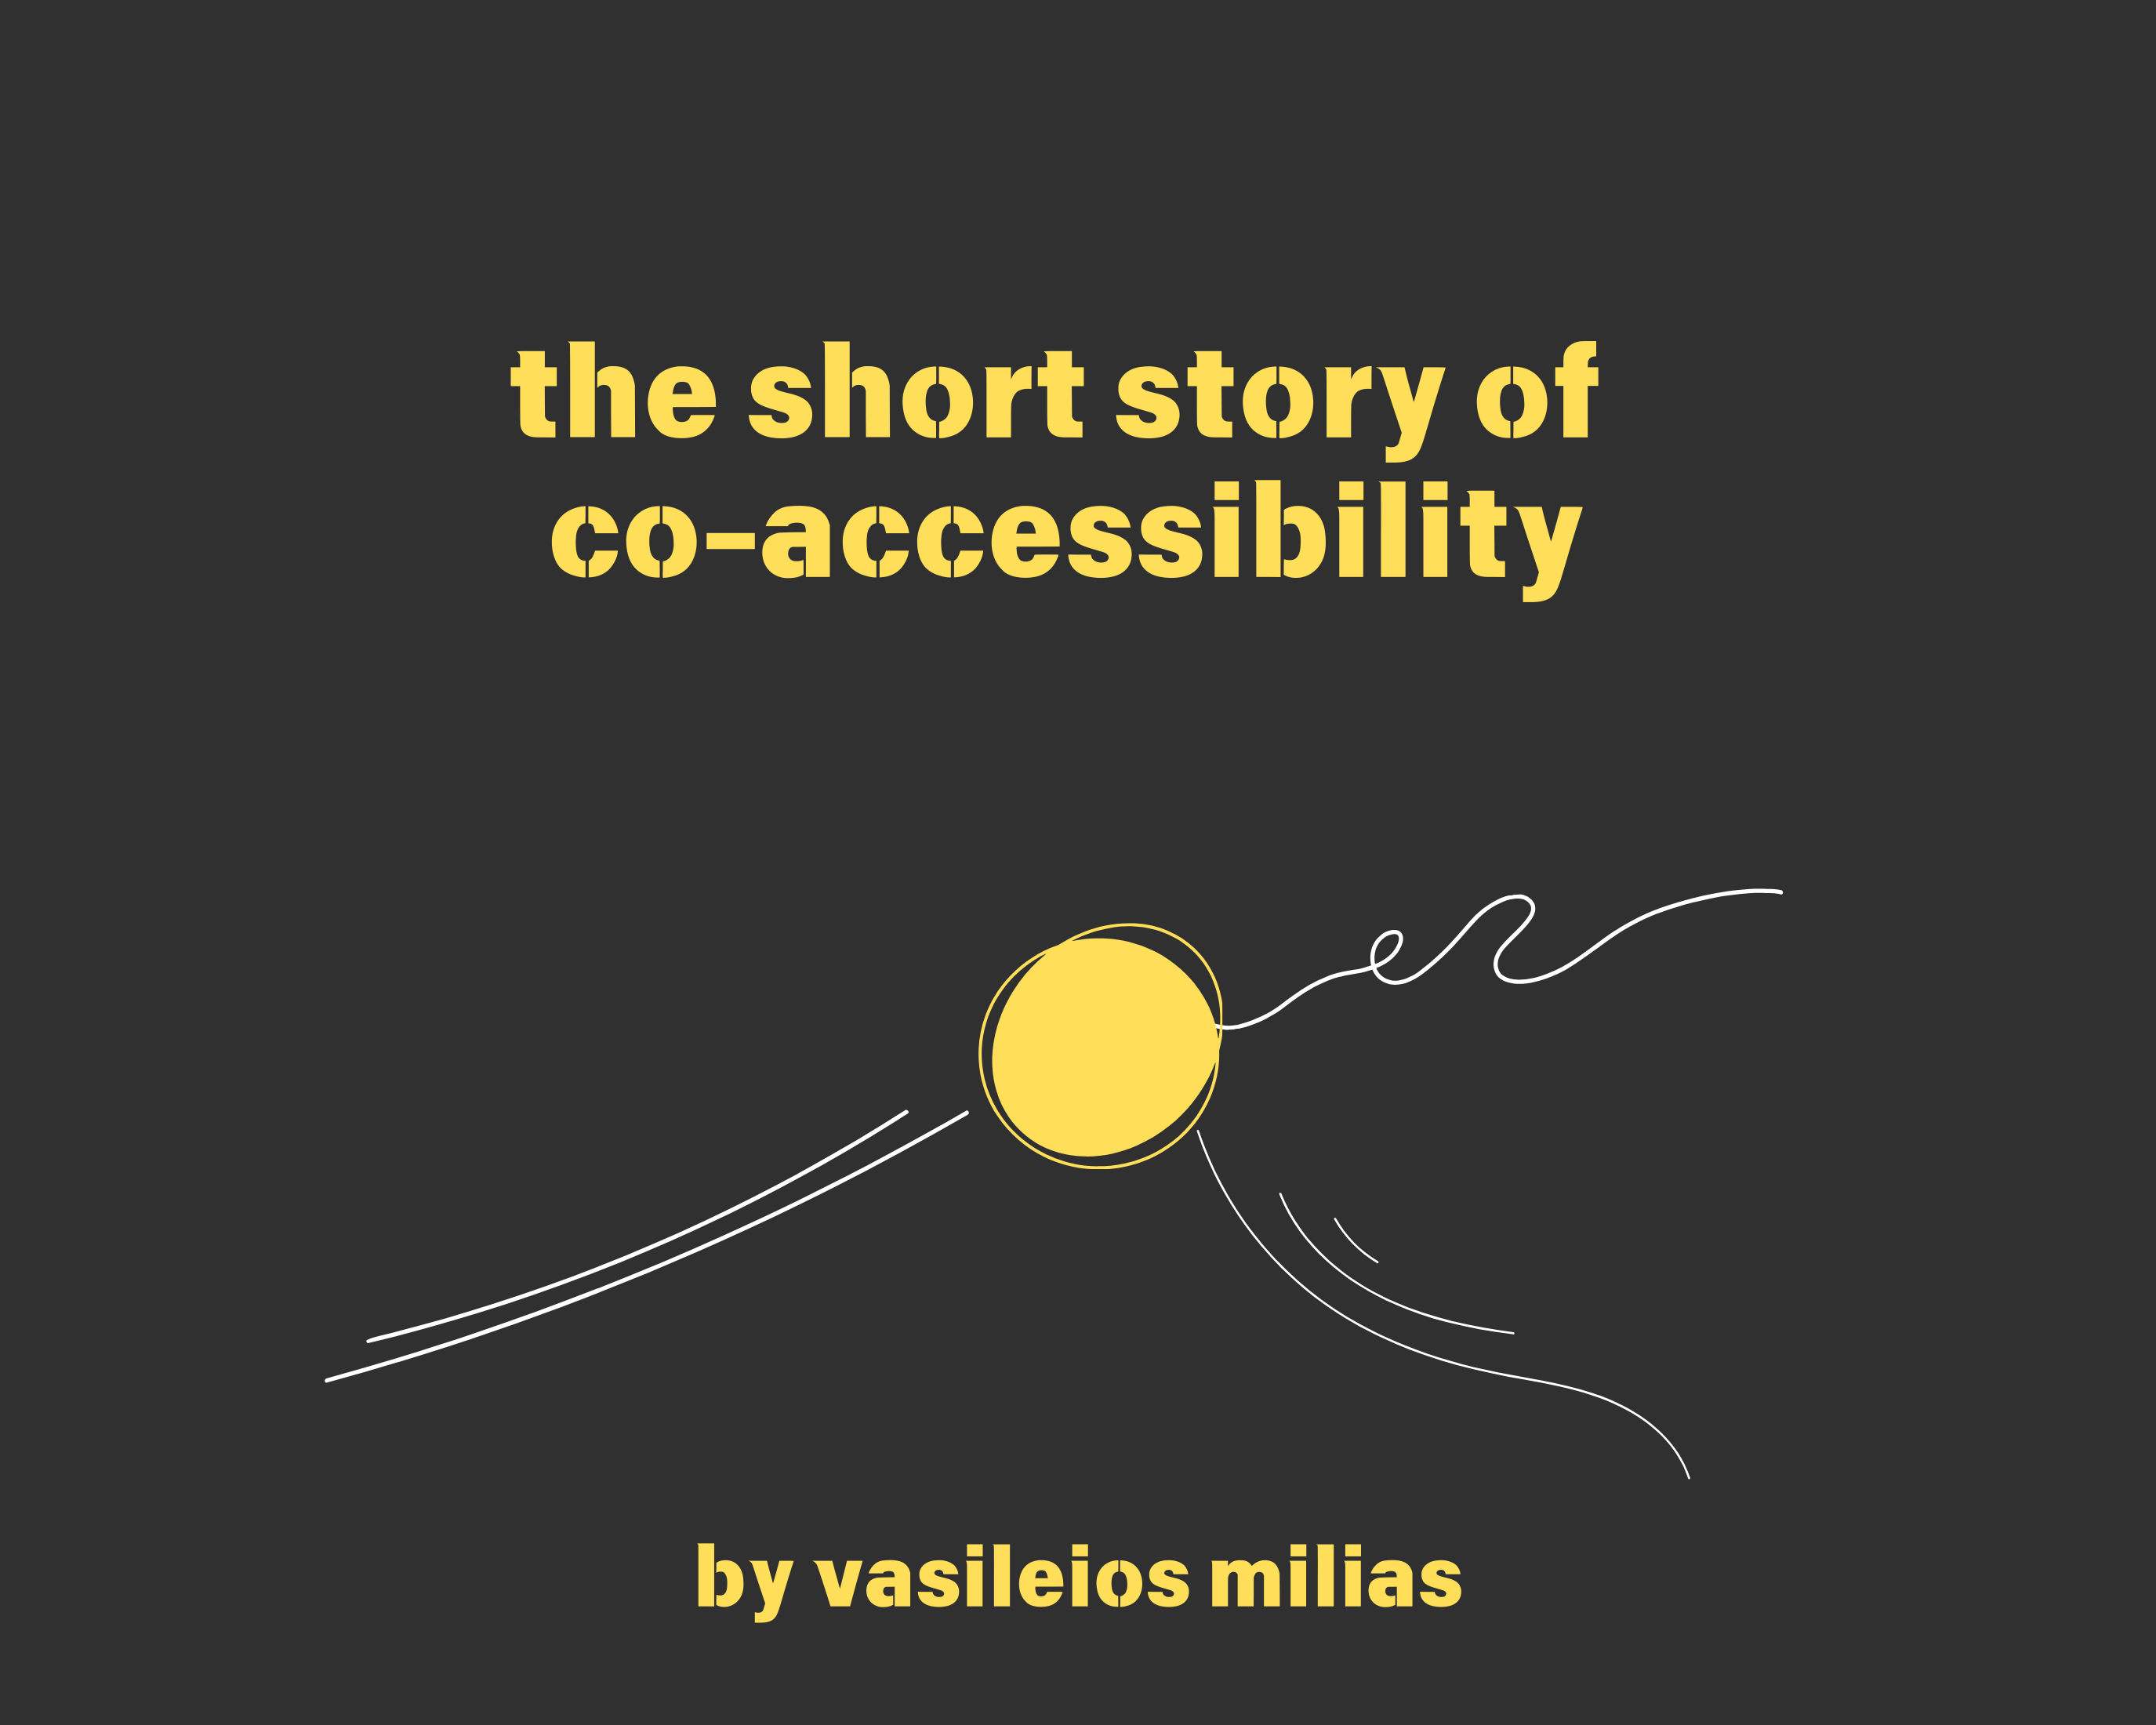
Vasileios Milias
(Βασίλης Μηλιάς)
My research spans the fields of urban mobility and urban analytics. Within these domains, I focus on developing computational methods, tools, and indicators for evaluating the degree to which urban areas are (co)accessible, walkable, inclusive, sustainable, safe, and attractive for all. Through my work, I aim to support the UN's SDG 11: "Make cities and human settlements inclusive, safe, resilient and sustainable".
In 2024, I obtained my PhD in Urban Analytics at TU Delft , as a member of the Urban Analytics Lab. In my PhD, I introduced and studied the concept of urban co-accessibility: a destination’s potential to bring together different individuals and individuals from diverse demographic groups. Throughout this work, I engaged in an in-depth investigation of urban accessibility, spatial data science, and machine learning .
News
Part of the newly funded Horizon Europe and New European Bauhaus ROUTES (Reimagining Open Schoolyards and Urban Streets as Equitable Spaces) project.
Guest lecture at NTUA's School of Architecture as part of Dimitris Papanikolaou's course "Network Ecologies: Humans, Algorithms, and Urban Synergies in a Finite World"
Published new research in collaboration with TT on how street-level imagery can support the design of heat-resilient cities. Check it HERE
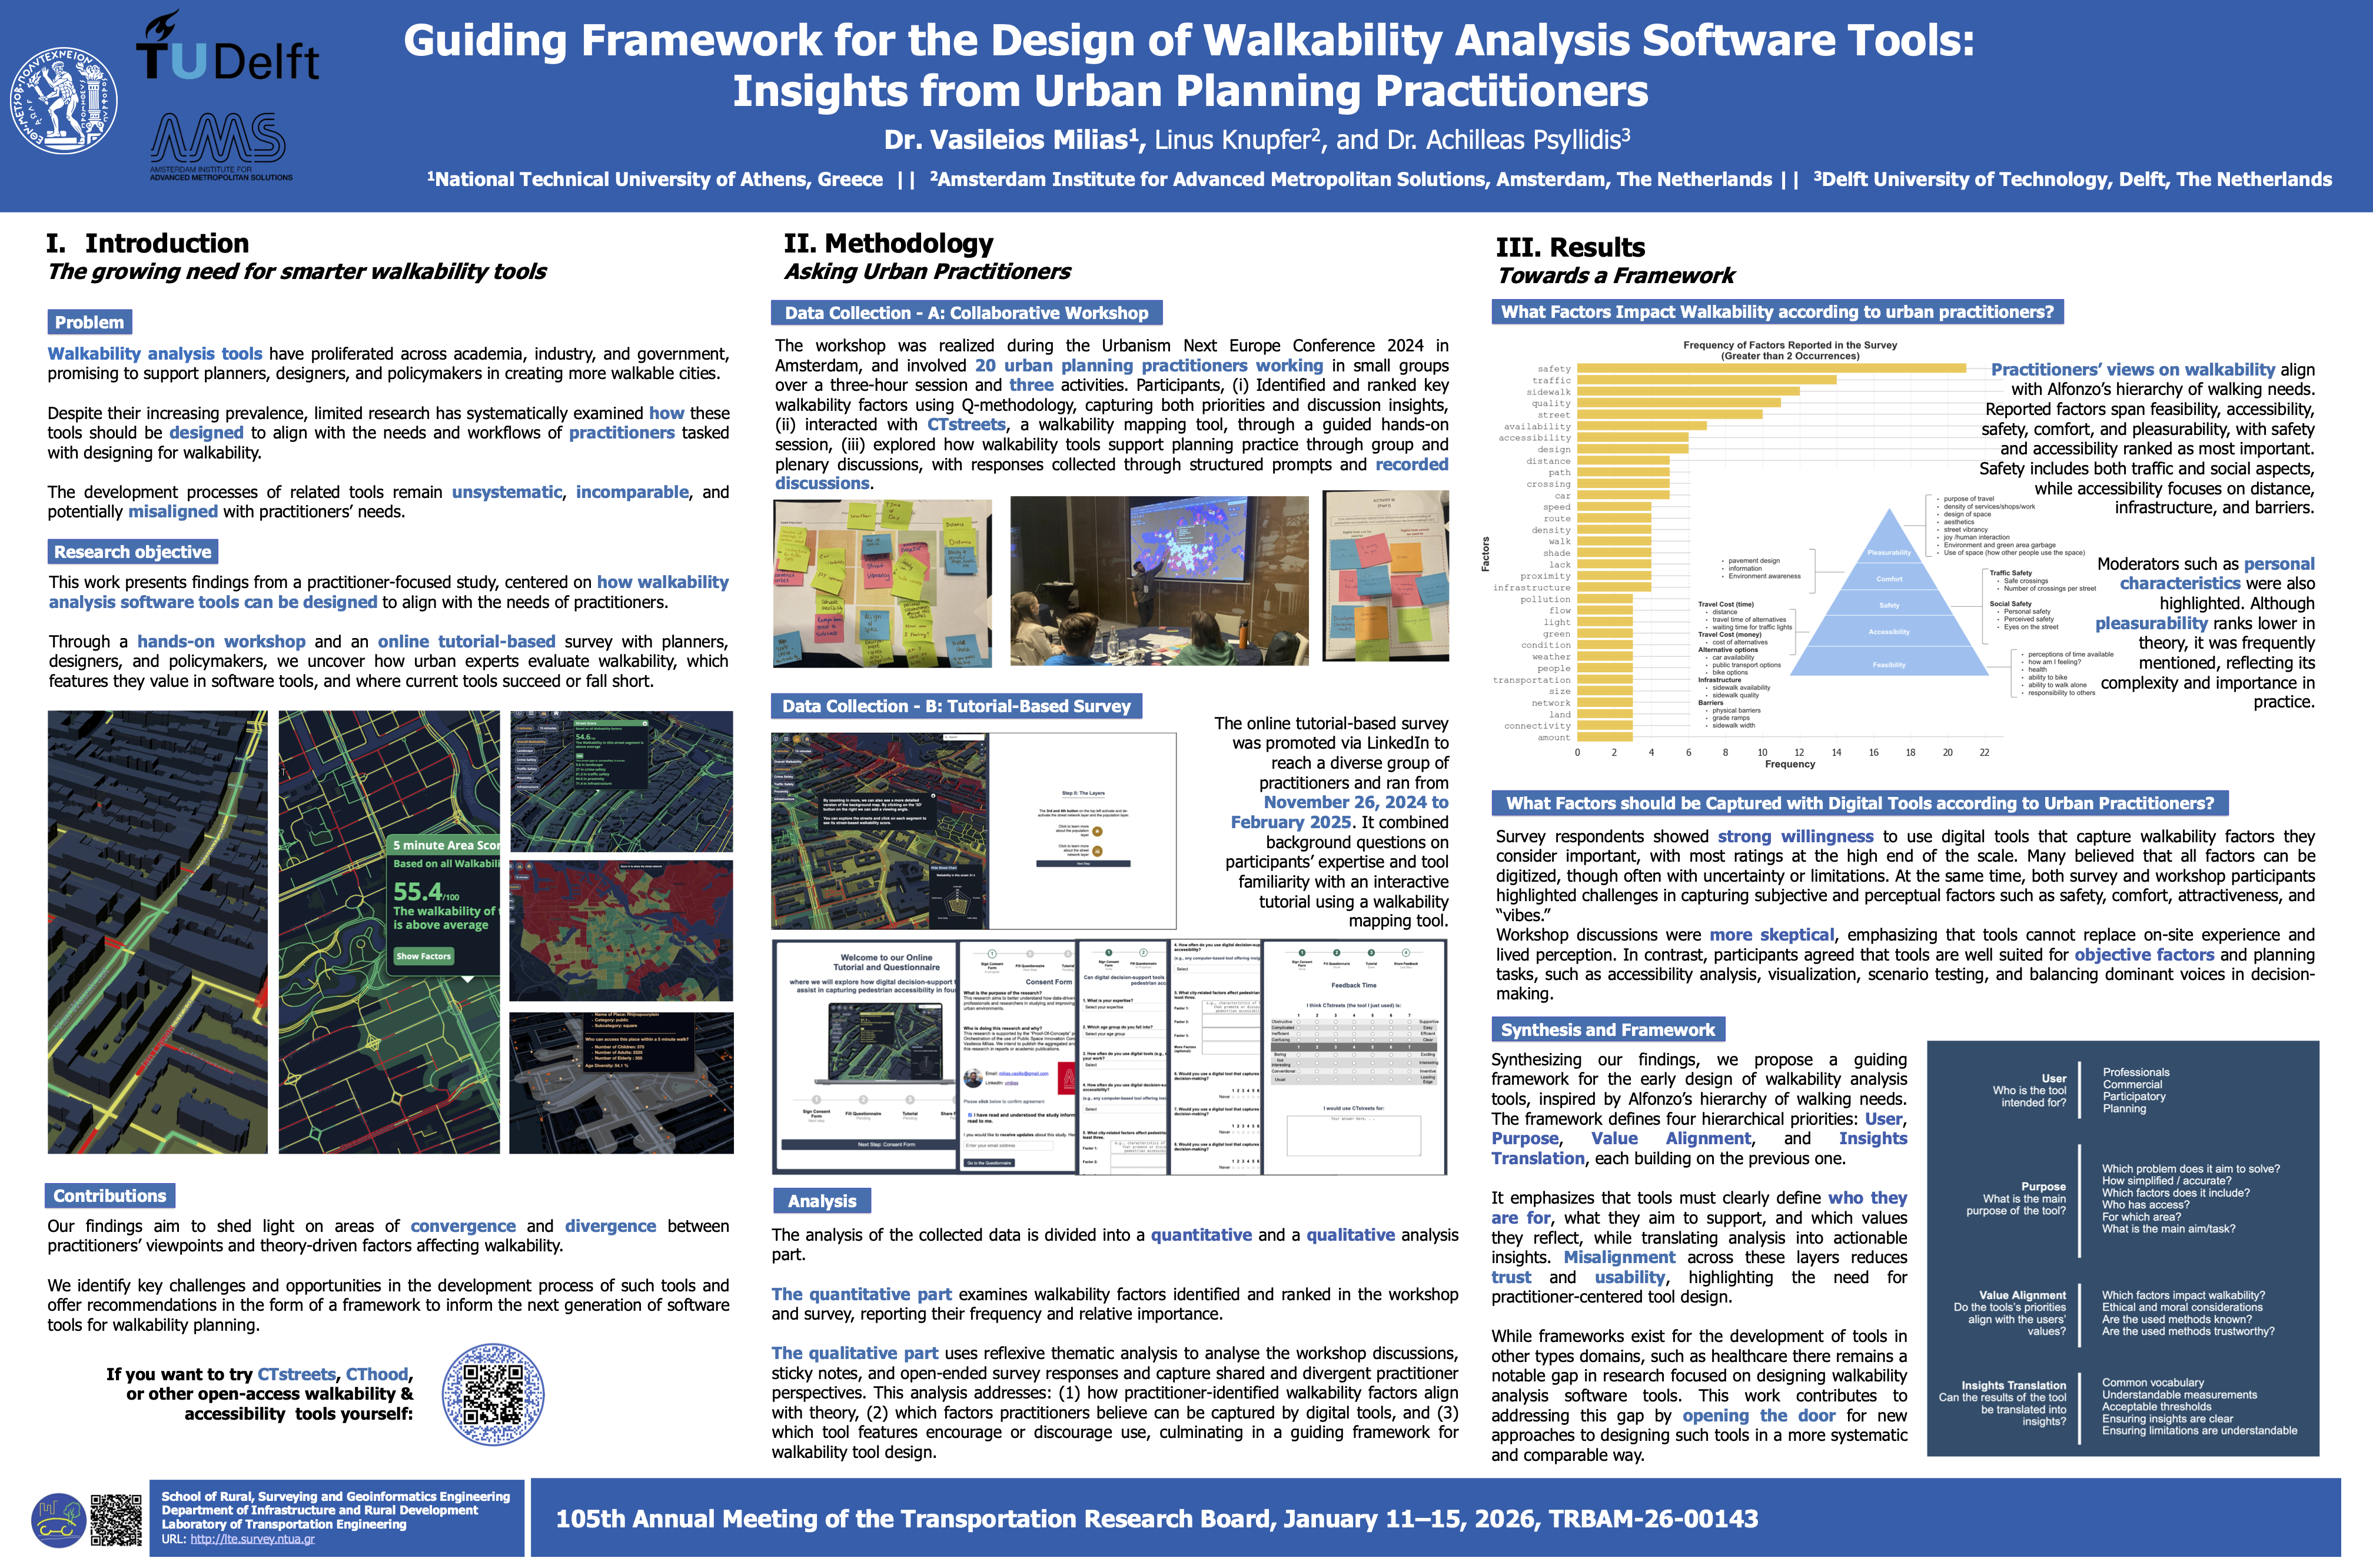
My poster on "Guiding Framework for the Design of Walkability Analysis Software Tools: Insights from Urban Planning Practitioners" was featured in the 105th annual meeting of the TRB, 2026 ". Check it HERE
Published a journal article in Environment and Planning B, entitled "Assessing equitable access in X-minute cities through open spatial data". Read HERE
Gave an invited talk entitled "From accessibility to co-accessibility" during the art exhibition Constant bliss in the city at Circuits and Currents project space of the Athens School of Fine Arts(Greece)
Published a policy paper "A practitioner-guided framework for urban analysis software" in collaboration with AMS institute. Read HERE
Discussed in SKAI Radio with Katerina Drakou about CThood and how to study to what degree Athens is a 15-minute city. Listen HERE (starting at 25').
Interviewed by ΝEWS247 about CThood and to what degree Athens is a 15-minute city. Read HERE.
Published two papers in the CUPUM2025 conference, in London, UK, on CTWalk and on Population-specific factors of pedestrian accessibility
Co-organized and presented in a workshop entitled "" Walking the X-min City: Methods and implementations to assess walkability and pedestrian accessibility at the Agile2025 conference in Dresden (Germany).
Participated in a panel discussion at the Aristotelis Climate Forum in Athens. Check it HERE.
Lead the workshop on “X-min cities, pedestrian accessibility, and digital tools“, during the Urbanism Next Europe Conference in Amsterdam (Netherlands)
Obtained my PhD! Read my open access PhD dissertation entitled "Urban Co-accessibility" HERE
Presented my work at the ΕΣΧΣΑ - 1st Scientific Conference on Spatial Planning and Development (Thessaloniki, Greece). Read it in the book of abstracts HERE
Started working remotely as a Senior Researcher at AMS institute.
🏆 Won the first prize demo award for CTwalk MAp at the NWO ICT.OPEN conference.
Gave an invited talk at TNO on "CTwalk and CTstreets: Exploring Walkability and Pedestrian (Co)Accessibility through Interactive Maps".
Lead the workshop on “What Factors Impact Access to Public Spaces and for Whom?“, realized in the City Hall of Helsinki (Finland) with Equal-Life's researchers and stakeholders.
CTwalk Map featured in Rafagas Links "#2103: cities, biodiversity, minefield". Read HERE.
Published and presented a paper in the AGILE2023 conference, in Delft, Netherlands. Read HERE.
Published and presented a paper in the CUPUM2023 conference, in Montreal, Canada. Read HERE.
Lead the workshop on “What Factors Impact Access to Public Spaces and for Whom?“, with the support of the American Planning Association. Read HERE.
Presented CTwalk Map and how to map walking accessibility of different population groups at the National Program for Sustainable Digital Information Management Demo Day. Read HERE
Gave an invited talk at TU Delft’s CityAI Lab on computational methods for assessing accessibility.
Short CV
Work Experience
Education
My top picks
Research
My research focuses on the potential of people to move through cities and access essential services, and on how urban form, transport, terrain, climate, and social diversity shape that potential. I enjoy combining open data, geospatial analysis, and visualization methods to understand accessibility, walkability, and broader urban mobility patterns in ways that go beyond simple distance metrics.
I also explore ways to transform my research into replicable tools such as CThood, CTstreets, and CTwalk, that aim to help cities evaluate mobility and proximity-based planning more realistically at scale. More broadly, I’m interested in supporting the design of sustainable, resilient, and healthy urban environments where mobility systems work for everyone and everyday movement is both feasible and enjoyable.
PhD Research
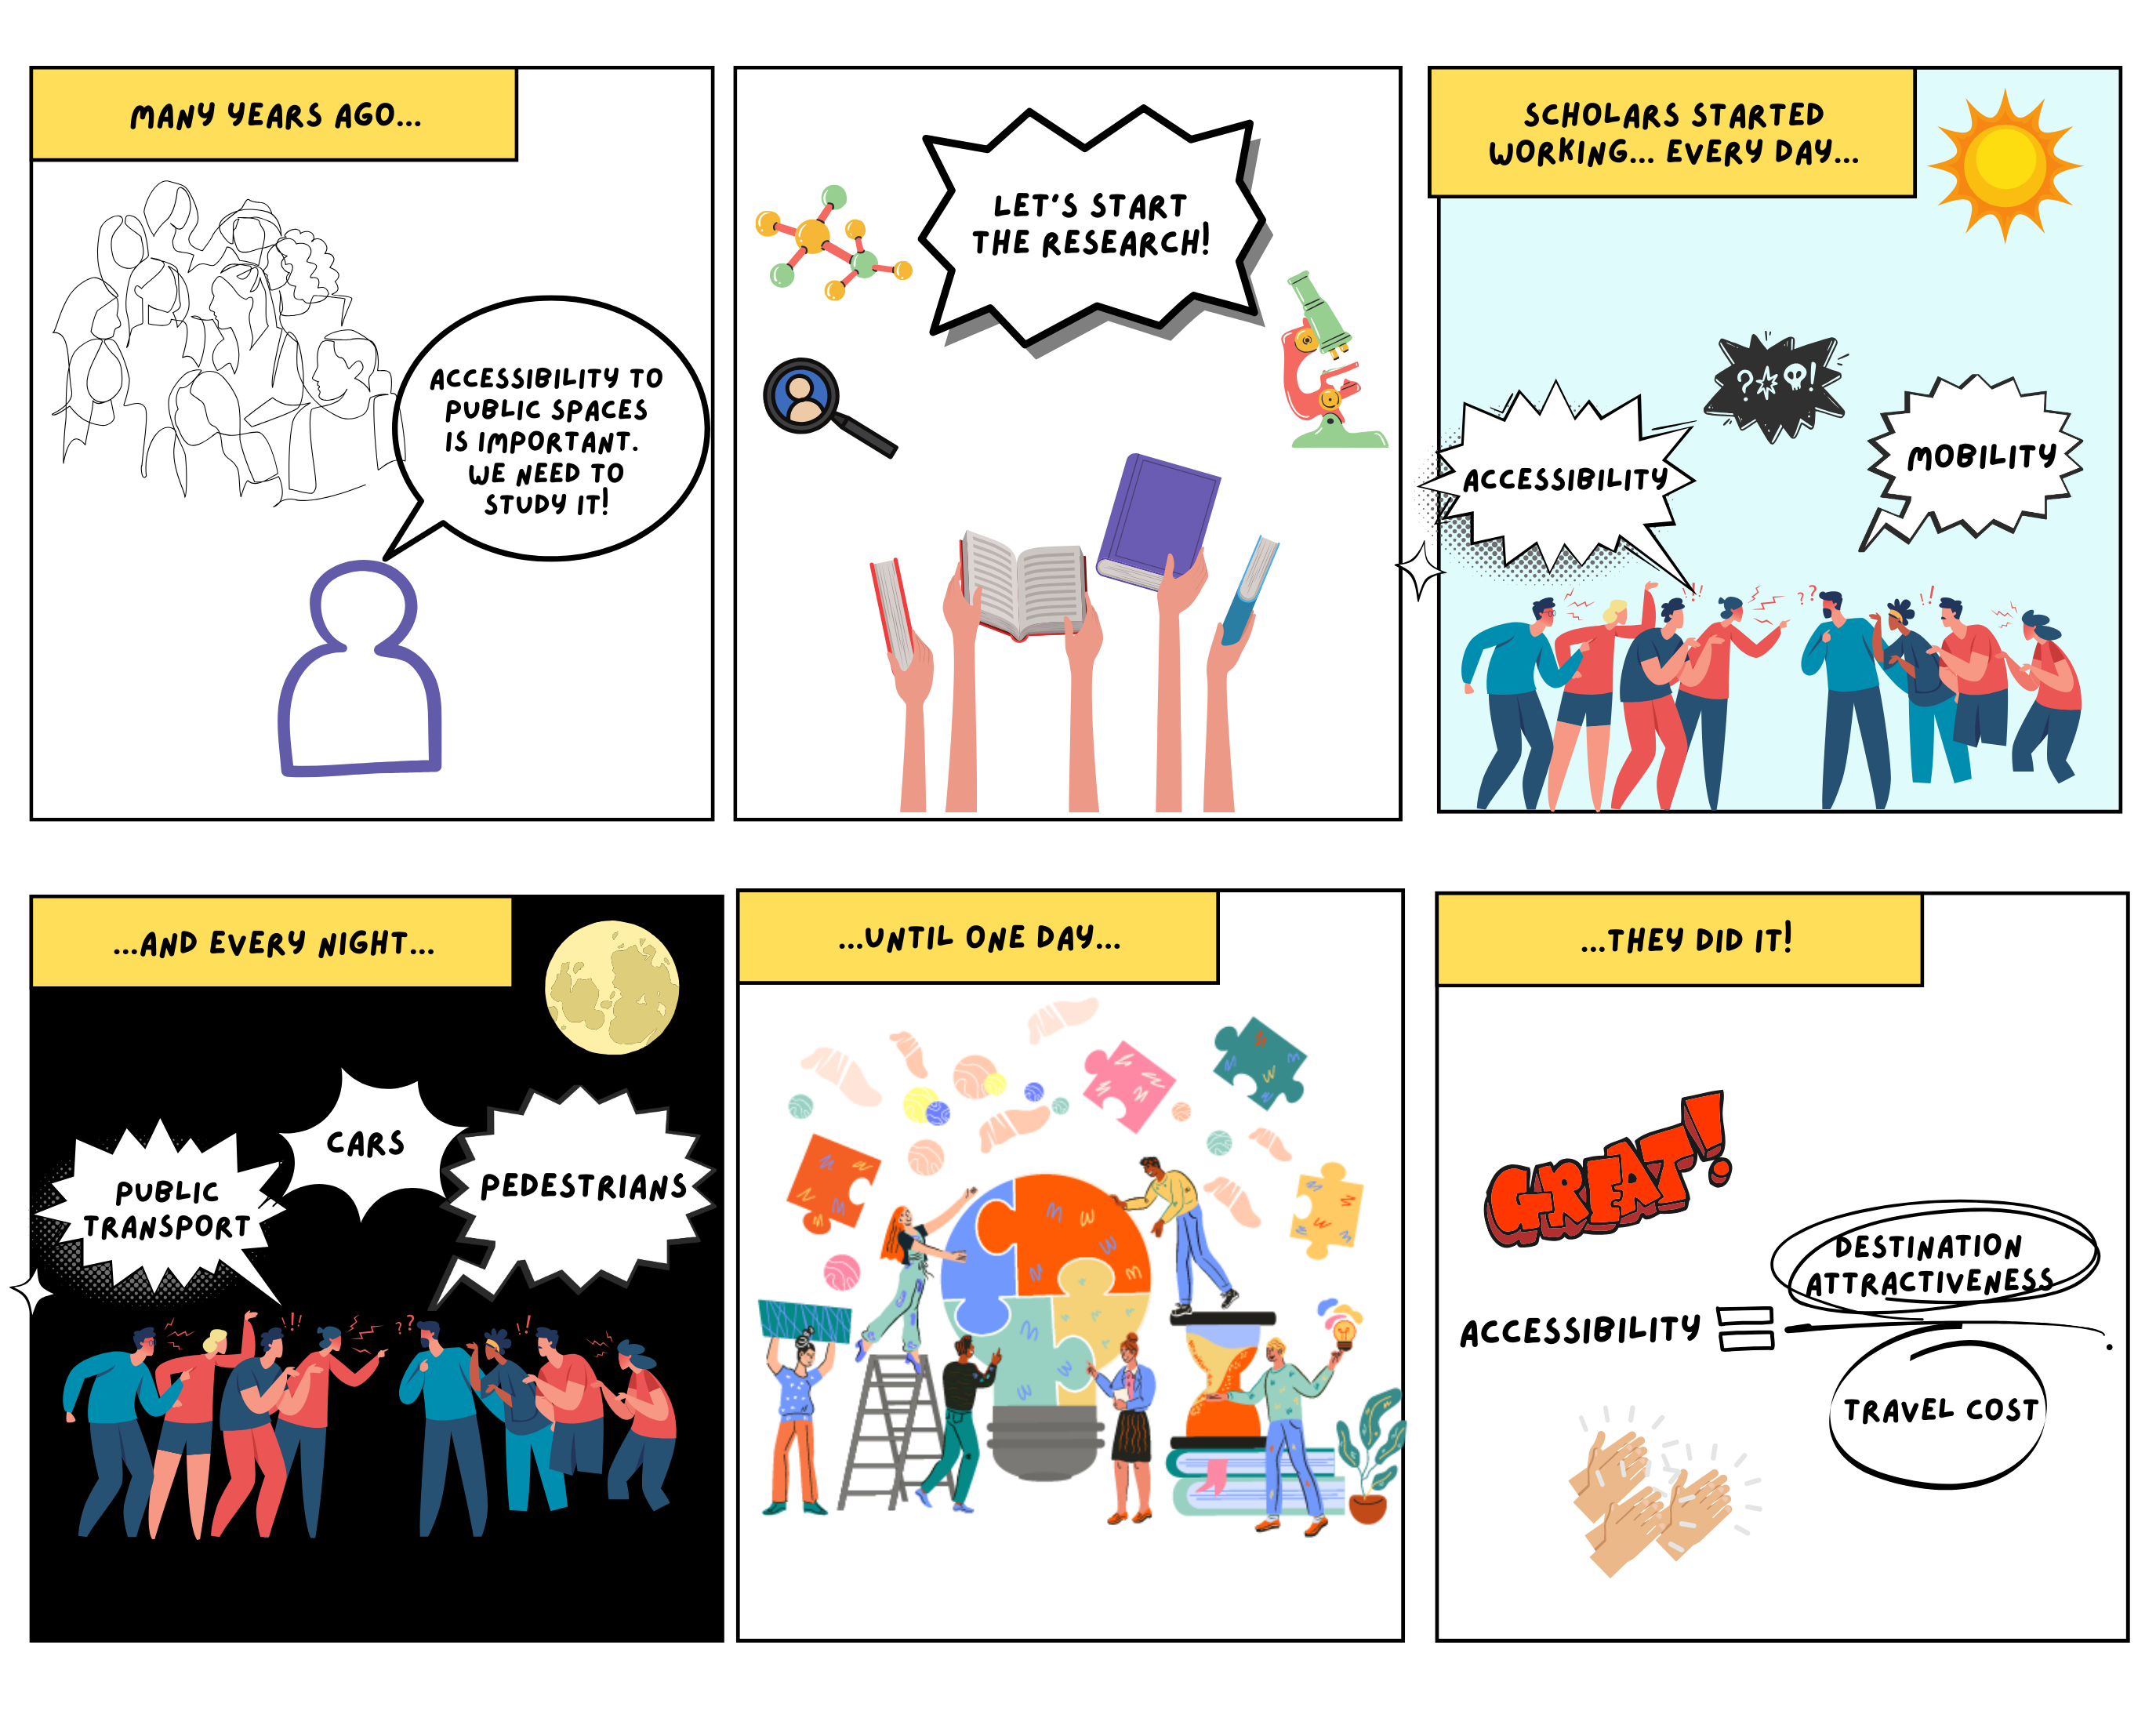
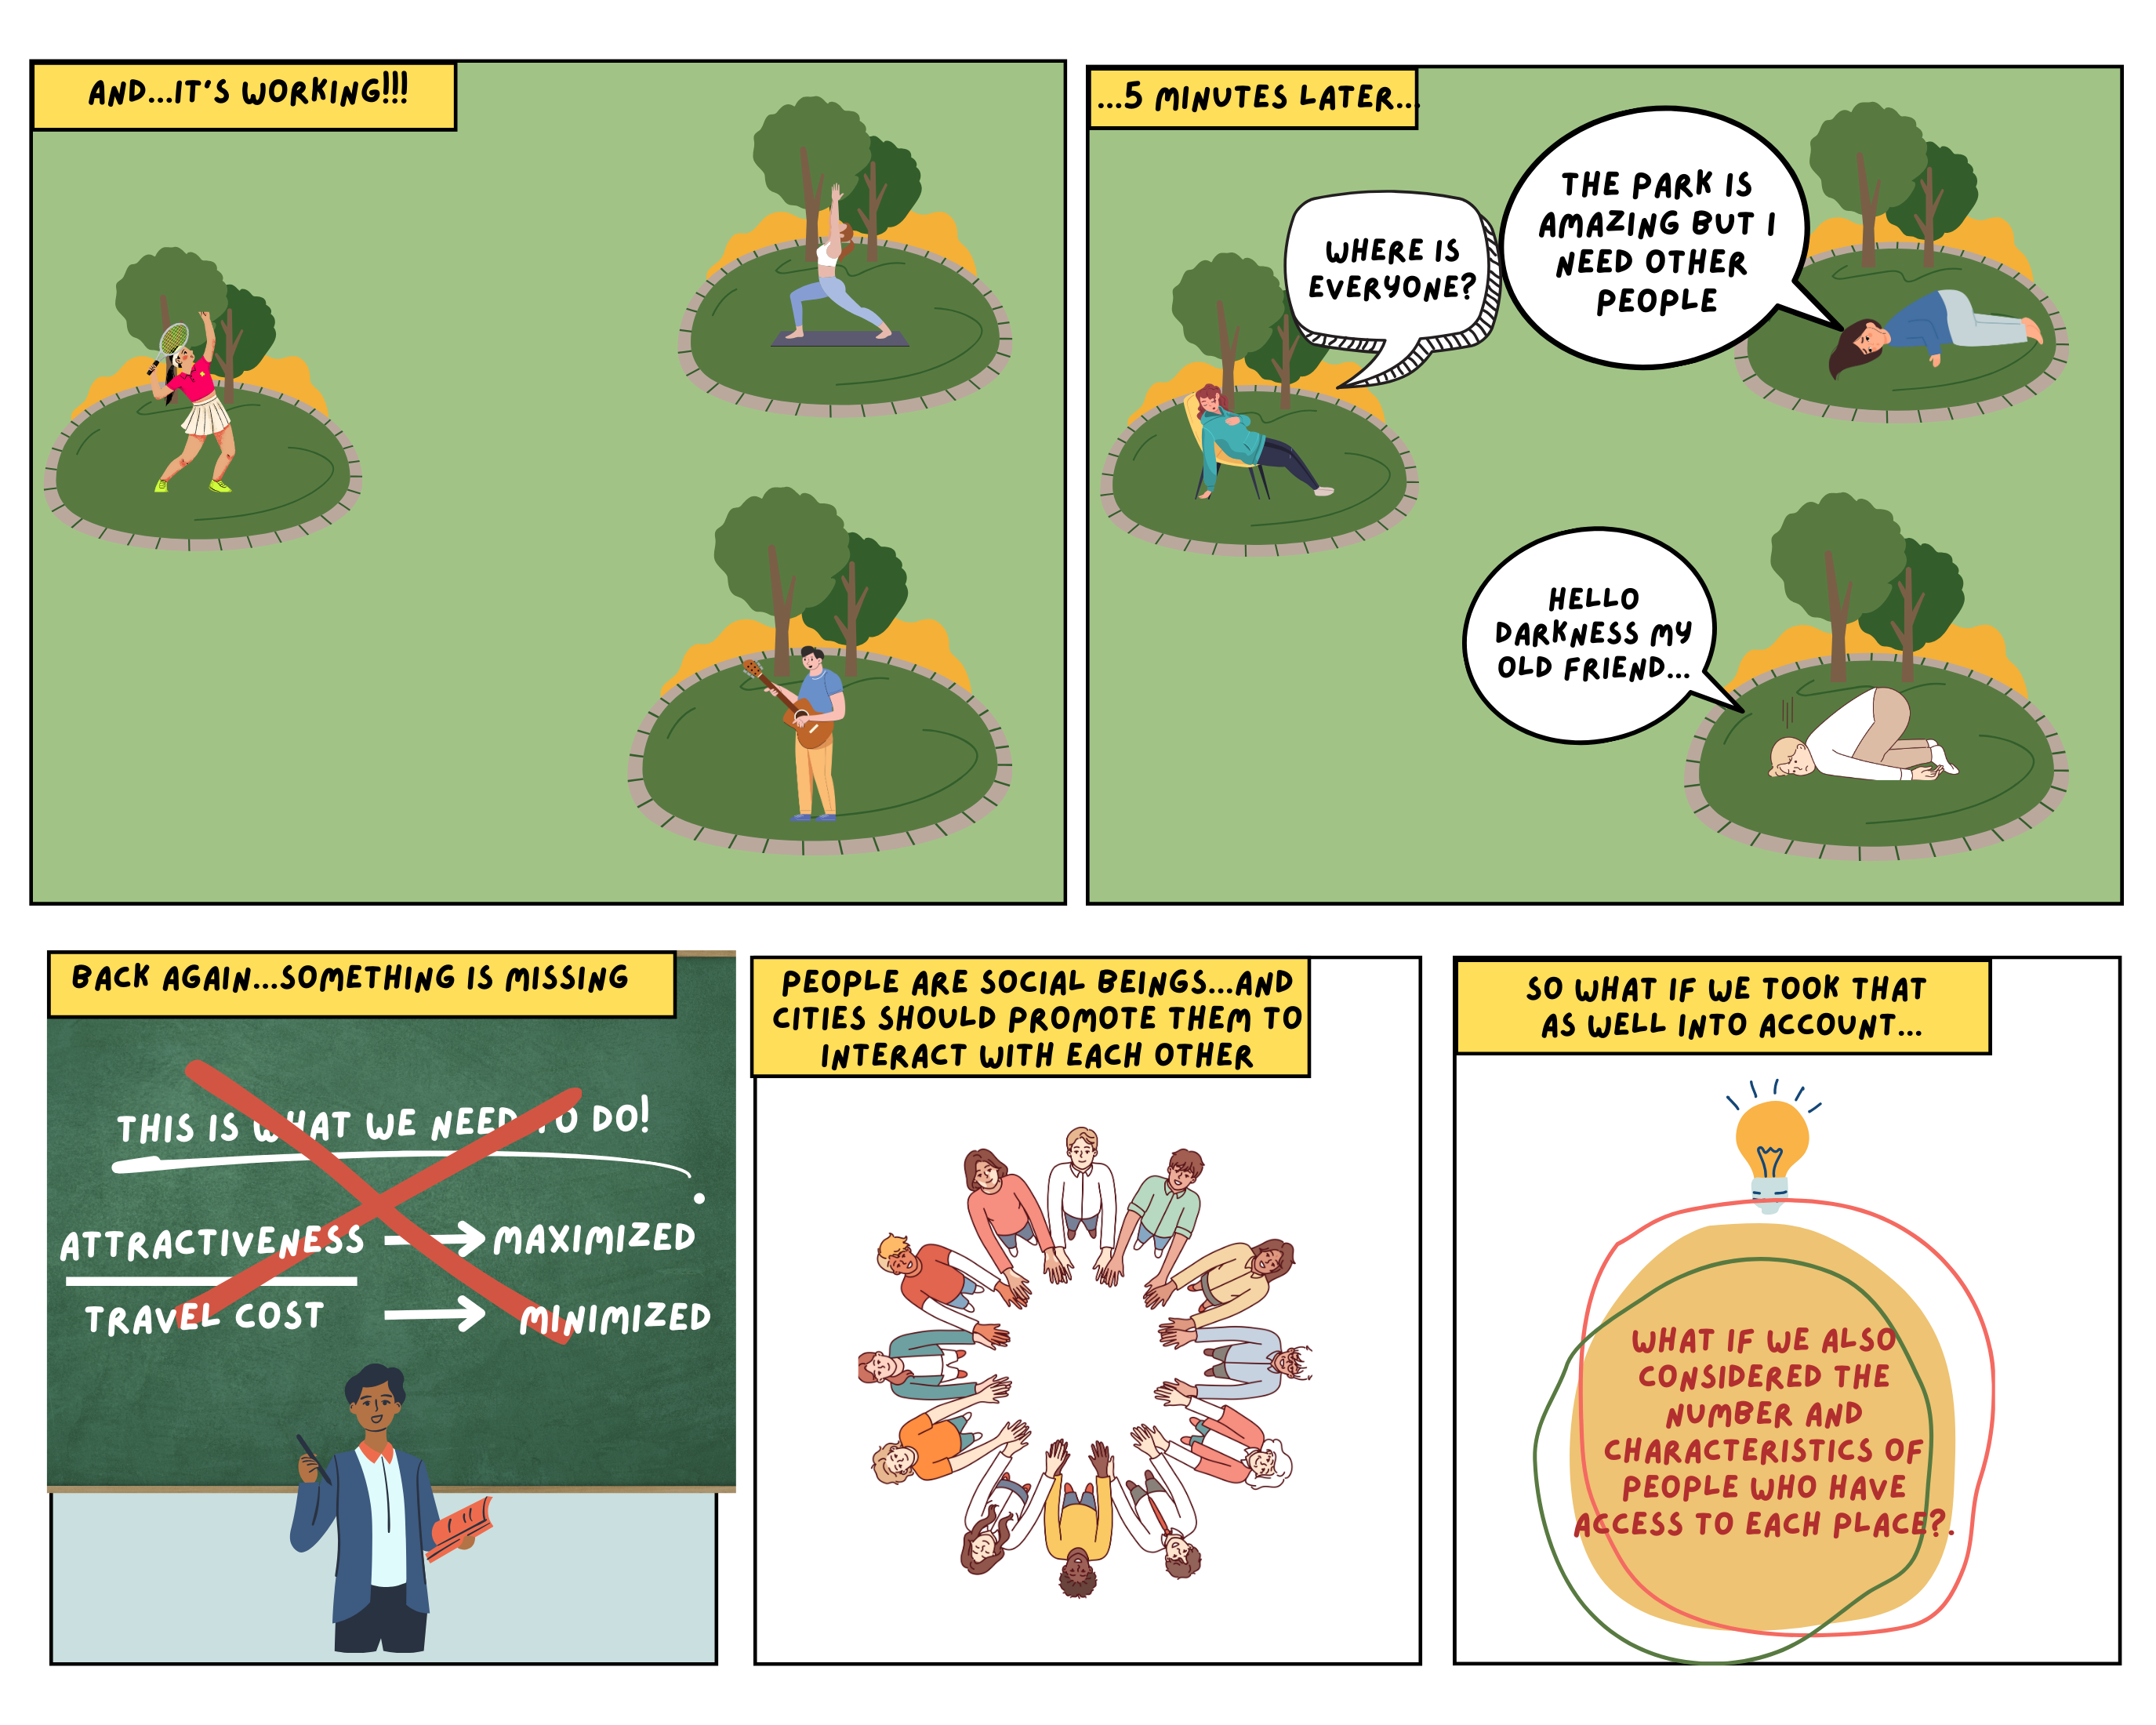
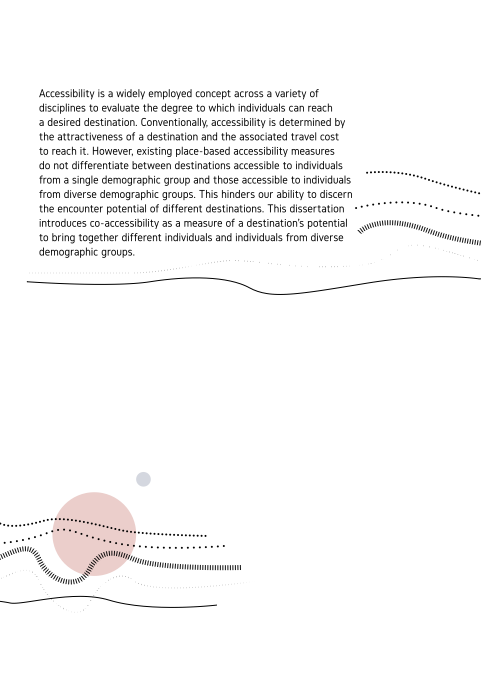
I began my PhD by examining accessibility, a widely employed concept across a variety of
disciplines to evaluate the
degree to which individuals can reach a desired destination.
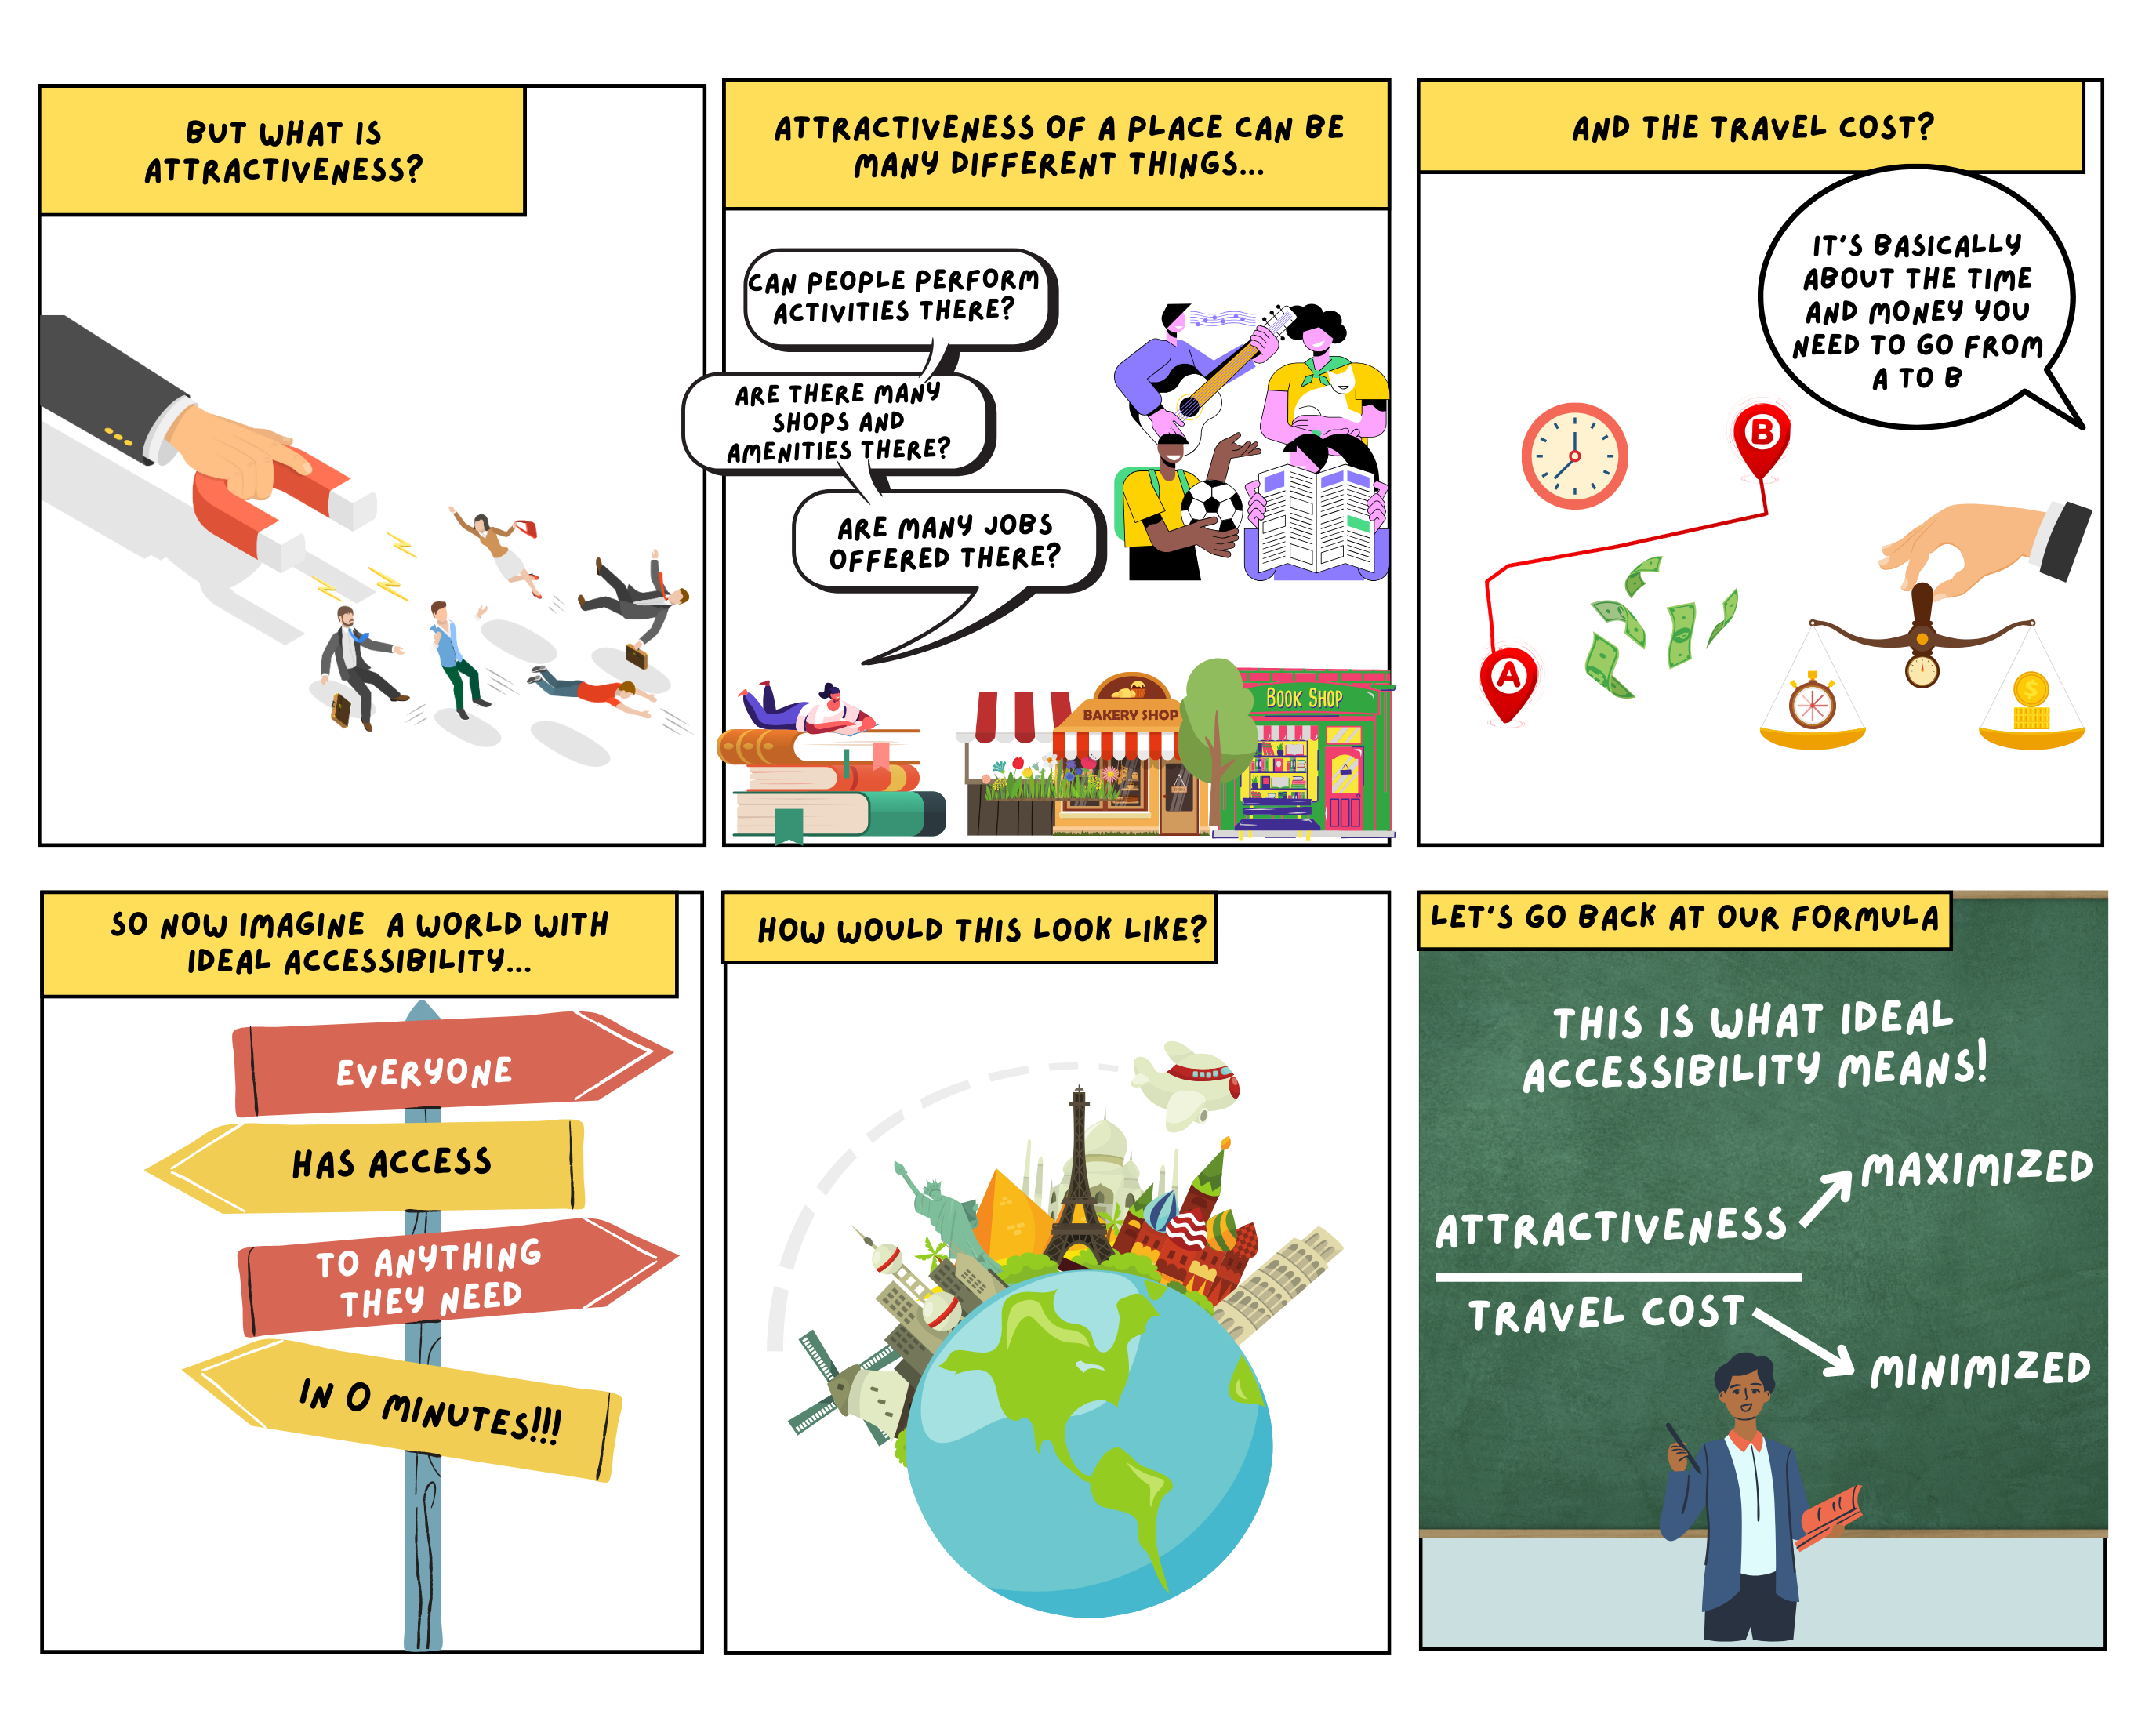
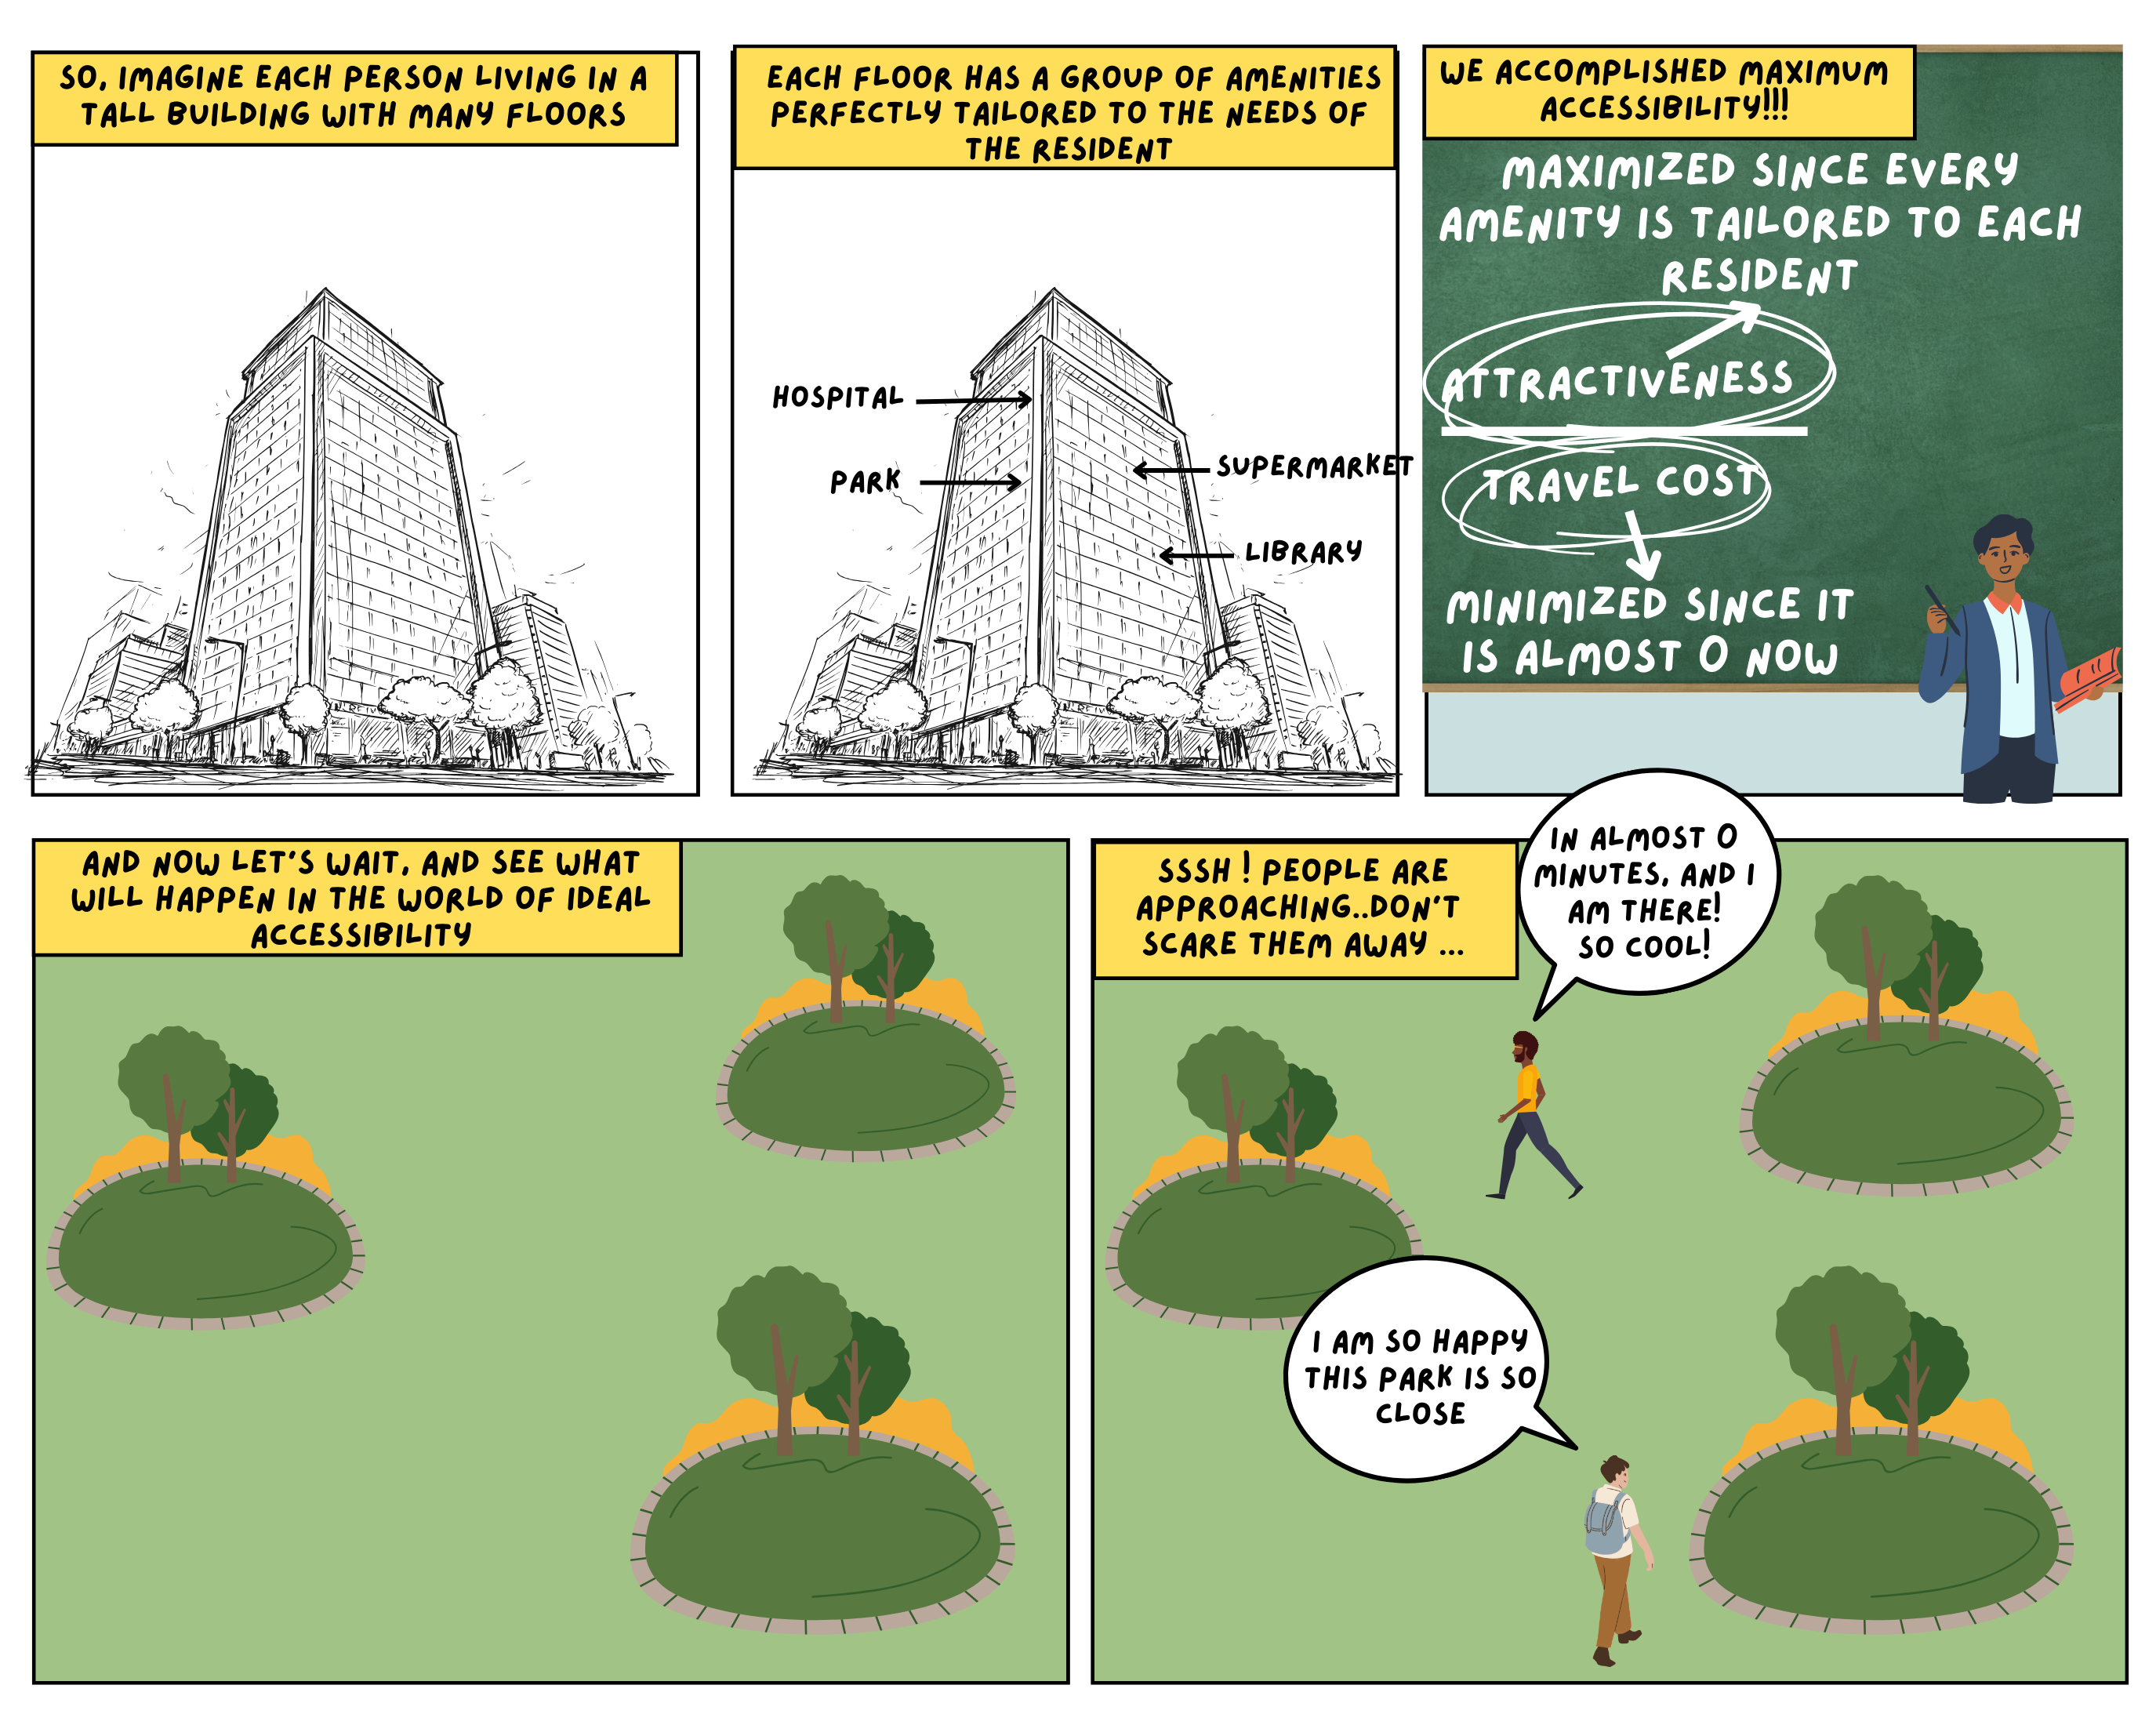
Conventionally, accessibility
is determined by the attractiveness of a destination and the
associated travel cost
to reach it.
However, existing place-based accessibility measures do not
differentiate
between destinations accessible to individuals from a single demographic group and
those accessible to individuals from diverse demographic groups.
This hinders
our ability
to discern the encounter potential of different destinations.
In my PhD research, I addressed this gap by
introducing co-accessibility as a measure of how accessible a given destination
is to different individuals and demographic groups.
If you want to know more about urban co-accessibility you can read my dissertation HERE .
Too long? Then check below the short story of co-accessibility as a comic.
Projects & Tools
Tools
This interactive map explores how urban form influences outdoor thermal comfort in Milan.
You can visualize hourly Physiological Equivalent Temperature (PET),
examine street-level shadow patterns, and compare composite urban indicators derived
from image-based features.
CThood, an open-access data-driven software tool designed to
map the
access inequities withιn the X-minute city paradigm. By leveraging
open data sources, CThood
evaluates the accessibility within 5- and 15-minute walking
distances of 14 distinct types of places,
allowing users to identify accessibility-related strengths and
weaknesses of the X-minute neighborhoods.
Combining an egalitarian and a sufficientarian perspective, CThood
assesses both how equally amenities
are distributed and whether any areas are excluded from basic,
essential services.
CTstreets Map is an interactive web tool that seeks to
highlight how
walkable are the streets of Amsterdam. It uses granular population,
location, and pedestrian network
data from open sources to estimate how walkable each street is. It
has been designed through a
participatory approach involving urban experts who live and work in
Amsterdam. It estimates the degree
of walkability for the 5 and 15-minute walking areas from each
housing block in Amsterdam, revealing
neighborhoods that encourage walking and exposing disparities in
walkability.
The Social Distancing Dashboard offers interactive city maps
that show
at street and neighborhood level whether people moving through
public space can keep to the distance
rules. It provides an overview of various aspects – such as the
width of footpaths and the location of
bus stops – that influence the extent to which we can actually
comply with the distance rules. In this
way, it can contribute to raising awareness of the limitations that
the design of public space entails
and to decision-making about COVID-19-related interventions in the
city.
Projects
Across Europe, schools are among the most accessible public facilities, yet their potential as community spaces remains largely untapped. Schoolyards are often inaccessible outside school hours, while surrounding streets can be dominated by traffic and fragmented planning approaches. The new ROUTES project (Reimagining Open Schoolyards and Urban Streets as Equitable Spaces) aims to address this challenge by exploring how integrated transformations of schoolyards and school streets can create safer, healthier, and more inclusive neighbourhoods.
While digitalisation holds great promise,
it has not yet brought about a full transformation towards
sustainability.
Across Europe, many smart city initiatives are already using
technology to reduce environmental impacts.
However, governance systems often struggle to keep pace with rapid
technological change, leaving a gap between
innovation and implementation. GOLIA seeks to close this gap by
developing truly transformative approaches that
harness digital tools to advance sustainability in mobility.
Urban multimodal transportation systems integrate different modes and services to provide seamless
transportation to travelers. Mobility hubs are a transformative solution to address challenges
related to the efficiency and connectivity of multimodal transportation systems, as they expand
the role of public transport hubs by serving as pivotal nodes of a multimodal network.
The puzzle project aspires to revolutionize planning
and operations of urban multimodal transportation systems by developing an integrated
framework and innovative tools for planning and evaluating core aspects of mobility hubs.
The project envisages introducing a novel approach for identifying prominent mobility hubs, setting up their operations,
and assessing their performance.
By 2050, the urban population is expected to account for 82% of
the world’s population, posing major challenges for sustainable urban mobility.
A shift from private cars to public and shared transport is essential to address
problems such as air pollution, congestion and energy consumption.
The EU co-funded Seamless Shared Urban Mobility (SUM) project aims to
transform existing transport networks by introducing New and Shared Mobility (NSM)
integrated with public transport (PT).
Play Accessible Communities (PAC) İzmir aims to transform micro-mobility hubs into inclusive, healthy public spaces. Developed under the EIT Urban Mobility Co-Create New European Bauhaus (NEB) programme, the project brings together Play the City, İzmir Planning Agency, and Transform Transport. PAC promotes accessible neighborhoods by linking mobility with social engagement.
The EU-funded Equal-Life project will develop and utilise the
exposome
concept in an integrated study of the external exposome and its
social aspects and of measurable internal
physiological factors and link those to a child's development and
life course mental health. This will
be done using a novel approach combining exposure data to
characterise, measure, model and understand
influences at different developmental stages. The goal is to propose
the best supportive environments
for all children.
Libraries-Code
A Python library for calculating prospective social encounters
between
persons from different demographic groups.
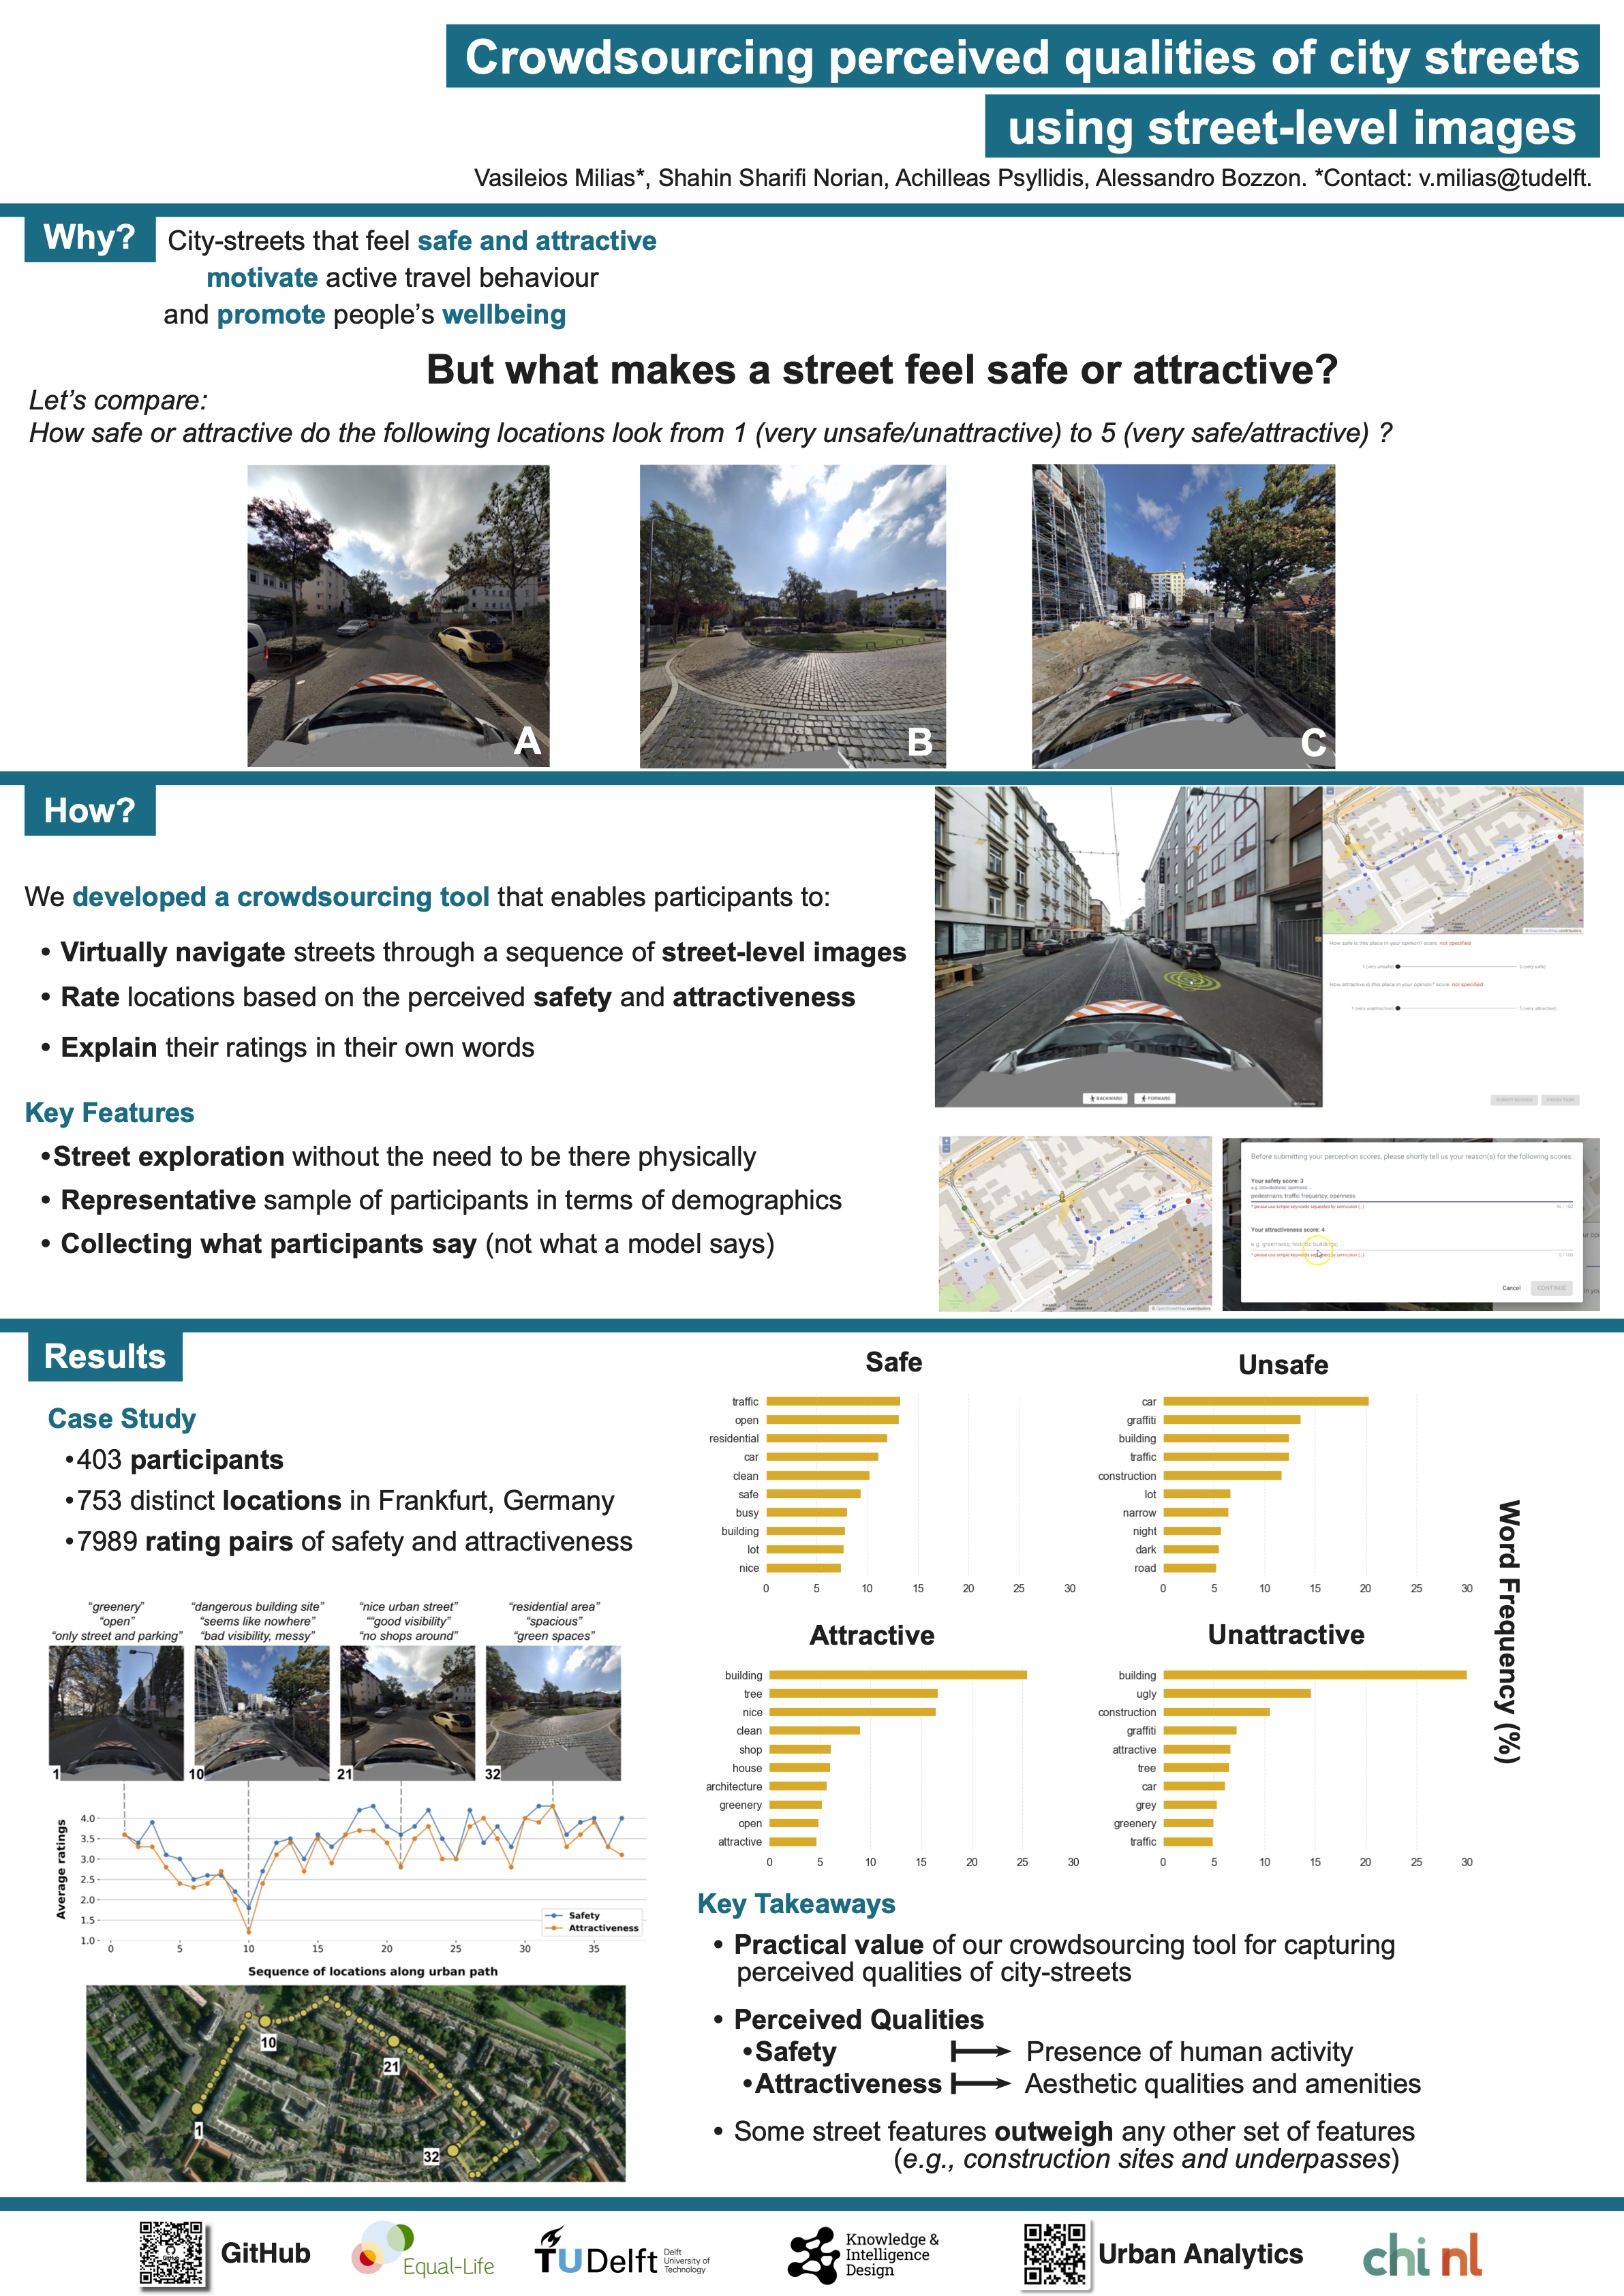
A Python and Javascript toolkit for calculating perceived
safety and
attractiveness of city streets through crowd parcipation.
Other
The goal of this competition was to identify from which camera
models
images were taken. My team’s solution was based on deep learning
techniques using Python (Keras
library).
Datasets
- Part of the data can be explored visually through the open-access interactive map: CThood.
- Data cover Athens, Amsterdam, and Stockholm.
- Data reflect walking distances of 5 and 15 minutes.
- 9,700 ratings of outdoor spaces for different activities (Likert scale 1–5)
- 6,388 short explanations of these ratings
- Each location linked to its corresponding Google Street View image
- 7,989 paired ratings of perceived safety and attractiveness
- 6,388 short explanations of these ratings
- 403 participants and 753 locations
- 19,114 and 18,232 keywords used to explain safety and attractiveness ratings, respectively
- Co-accessibility scores of different types of urban places for 5, 10, and 15-minute walksheds
- Total number of people who have access to each urban place
- Number of people per age group who have access to each urban place
Conferences, Talks, Exhibitions & Workshops
> [2025] Constant Bliss in the City - Art Exhibition - Invited talk entitled "From accessibility to co-accessibility" during art exhibition at Circuits and Currents project space of the Athens School of Fine Arts (Greece).
> [2025] ICTR2025 Conference - Presented my work at the 12th international congress on transportation research in Thessaloniki "CThood: A tool for mapping pedestrian accessibility & uncovering access inequities in X-minute neighborhoods" (Greece).
> [2025] Agile2025 Conference - Co-organized and presented in a workshop entitled " Walking the X-min City: Methods and implementations to assess walkability and pedestrian accessibility at the Agile2025 conference in Dresden (Germany).
> [2025] Aristotelis Climate Forum - Participated in a panel discussion at the Aristotelis Climate Forum in Athens (Greece).
> [2024] Urbanism Next Europe Conference - Lead the workshop on “X-min cities, pedestrian accessibility, and digital tools“, in Amsterdam (Netherlands).
> [2024] ΕΣΧΣΑ - Presented my work at the 1st Scientific Conference on Spatial Planning and Development (Thessaloniki, Greece), on "CTwalk and CTstreets: Mapping Walkability and Pedestrian (Co)Accessibility through open data".
> [2024] 🏆 NWO ICT.OPEN conference - Received the first prize demo award for CTwalk Map at the NWO ICT.OPEN conference.
> [2024] TNO - Invited talk on "CTwalk and CTstreets: Exploring Walkability and Pedestrian (Co)Accessibility through Interactive Maps"
> [2023] Dutch Design Week - Exhibiting CTwalk Map in the DDW2023 with the support of 4TU.Design United
> [2023] National Program for Sustainable Digital Information Management Demo Day - Demonstration of CTwalk Map and talk on "Mapping accessibility with urban analytics: measuring is knowing?"
> [2023] Equal Life (H2020) - Workshop on "What Factors Impact Access to Public Spaces and for Whom?" at the Equal-Life Stakeholder Forum, Helsinki, Finland
> [2023] CPM - Workshop with the support of the American Planning Association and the Consulting Planners of Massachusetts on "What Factors Impact Access to Public Spaces and for Whom?"
> [2023] NWO ΙCT.Open conference - Poster presentation at NWO ICT.Open conference in Utrecht, the Netherlands on "Crowdsourcing perceived qualities of city streets using street-level images."
> [2023] EHEN conference - Presentation at EHEN conference in Leuven, Belgium on "Exposure to street environment features and perceptions of safety and attractiveness."
> [2023] TU Defft's CityAI Lab - Invited talk on "Computational methods for assessing accessibility"
> [2023] Towards Healthy Society conference - Presentation during interactive market on "How can accessibility promote wellbeing?"
> [2022] HERE Technologies - Invited talk on "From POIs to Accessibility and Beyond"
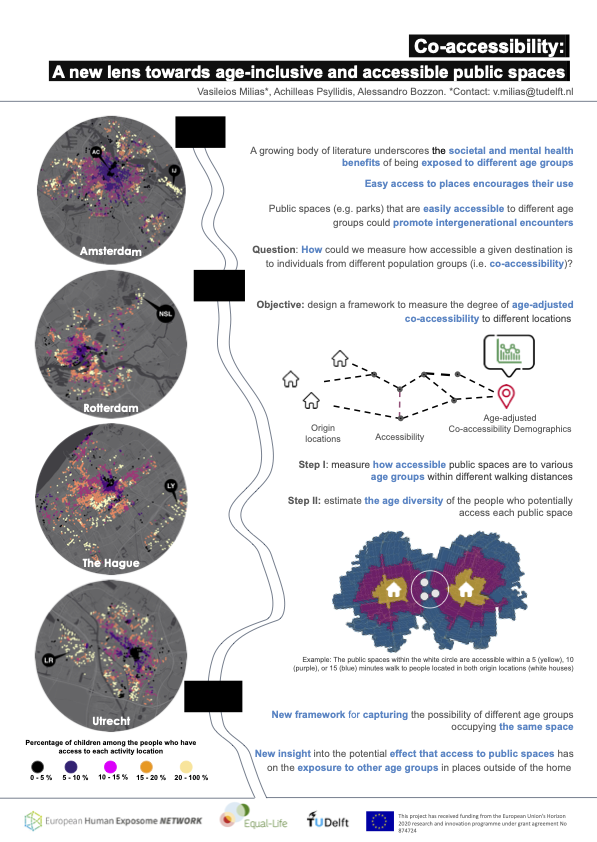
> [2022] EHEN conference - Presentation at EHEN conference in Barcelona, Spain on "Co-accessibility: A new lens towards age-inclusive and accessible public spaces."
Relevant Publications
PhD Dissertation
Peer-reviewed
> Milias, V., Psyllidis, A. (2025). CTwalk: A tool for mapping potential inter-population encounters in X-minute neighborhoods. 19th International Conference on Computers in Urban Planning and Urban Management.
> Psyllidis, A., Milias, V., (2025). Population-specific factors of pedestrian accessibility: Bridging practitioner insights and accessibility metrics. 19th International Conference on Computers in Urban Planning and Urban Management.
> Milias, V., Psyllidis, A., Bozzon, A.(2024). Bridging or separating? Co-accessibility as a measure of potential place-based encounters Journal of Transport Geography, 121, 10427.
> Milias, V., Teeuwen, R., Bozzon, A., Psyllidis, A. (2024). Crowdsourcing the influence of physical features on the likely use of public open spaces? Computational Urban Science Journal, 4, 15.
> Milias, V., Sharifi Noorian, S., Bozzon, A., & Psyllidis, A. (2023). Is it safe to be attractive? Disentangling the influence of streetscape features on the perceived safety and attractiveness of city streets. AGILE: GIScience Series, 4, 8.
> Van Asten, T.*, Milias, V.*, Bozzon, A., & Psyllidis, A. (2023). “Eyes on the Street”: Estimating Natural Surveillance Along Amsterdam’s City Streets Using Street-Level Imagery. In International Conference on Computers in Urban Planning and Urban Management (pp. 215-229). Cham: Springer Nature Switzerland.
> Milias, V. & Psyllidis, A. (2022). Measuring spatial age segregation through the lens of co-accessibility to urban activities. Computers, Environment and Urban Systems, 95, 101829.
> Milias, V. & Psyllidis, A. (2021). Assessing the influence of point-of-interest features on the classification of place categories. Computers, Environment and Urban Systems, 86, 101597.
For a full list of my publications check my Google Scholar page
Posters
Media
> SKAI Radio (2025). Discussed with Katerina Drakou about CThood and how to
study to
what degree Athens is a 15-minute city.
Listen here:
or check the entire episode HERE (starting at 25').
> Het Parool - Dutch Newspaper (2025). In a city like Boston, everyone runs faster and faster. Is Amsterdam still a city for strolling?. Featured in Het Parool discussing about people's walking behaviour in cities. I share insights on how urban design influences pedestrian behavior and why creating space for lingering is essential for vibrant, livable cities. (In Dutch)
> CHI NL - ICT.OPEN (2024). Featured in an article by CHI NL about receiving the ICT.OPEN Demo Award at the NWO ICT.OPEN conference.
> (TUD) Industrial Design Engineering News. (2023). New tool shows accessibility of public areas for different population groups. Article published by TU Delft about the CTwalk tool and my PhD research on co-accessibility.
> WHO - Book of abstracts. Towards the design of healthy and sustainable cities: What Factors Impact Access to Public Spaces and for Whom? Abstract for WHO European Healthy Cities Network Annual Business Meeting and Technical Conference.
>Onze Jeugd (Our Youth) (2023). Kinderen in de openbare ruimte. Urban Analytics Lab biedt inzicht in knelpunten leefomgeving (Children in public space) (The Urban Analytics Lab provides insight into bottlenecks in the living environment). .
> Open Access Government (2022). Equal-Life team: Improving child exposome and quality of life. Open Access Government.
Teaching
Courses
> Machine Learning for Design - Lectures/Tutorials, Assignments (BSc, IDE - TU Delft)
> Urban Data Science, Lectures/Tutorials, Assignments (BSc, IDE - TU Delft)
> AI for Society - Guest Lecture (MSc, IDE - TU Delft)
> MOOC for H2020 project "Periscope"
> Contributed to Advanced Machine Learning for Design (MSc, IDE - TU Delft)
> Moderator in Software Based Products (BSc, IDE - TU Delft)
Supervised MSc Students
> [2023] Charalampos Spanos (TU Delft Faculty of Architecture & the Built Environment). CONNECTING PLACES - CONNECTING PEOPLE: A network of public spaces as a backbone for social cohesion in South Rotterdam.
Contact
> LinkedIn: vmilias
> Github: MiliasV
> NTUA Page: milias-v
> TT Page: vmilias