Find out more about co-accessibility in our open access journal paper
Received first prize demo award in NWO ICT.OPEN conference 2024
What opportunities for social cohesion do cities provide?
Is your neighborhood park frequented by a homogenous or diverse mix of people? How many amenities can you reach within a short walking distance? And do you often encounter people from different walks of life?
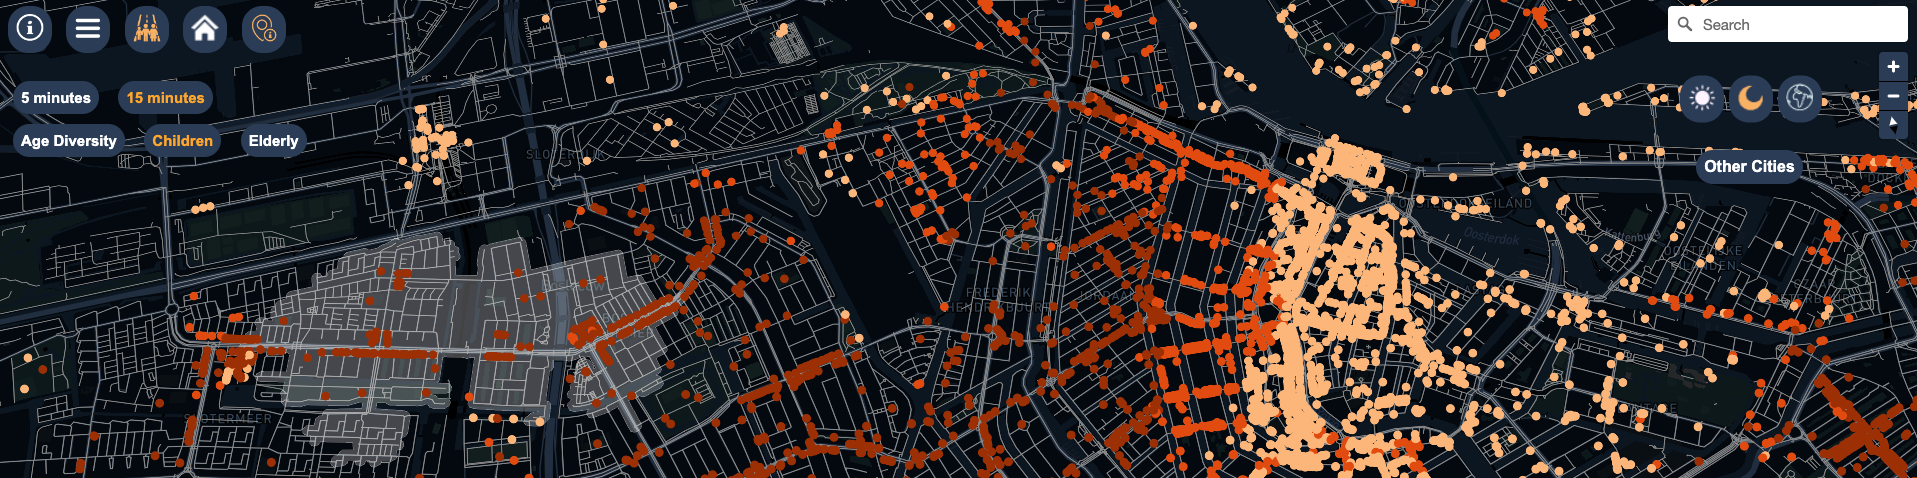
This is what the interactive CTwalk Map seeks to highlight.
- It uses granular population, location, and pedestrian network data from open sources to estimate how many children, adults, and elderly citizens can reach various destinations in a city within a short walk.
- It offers a simple and in-depth understanding of how the 5 and 15 minute walking environments are shaped by the street network.
- It estimates the degree of pedestrian co-accessibility of various city destinations to highlight the social cohesion potential of neighborhoods while also unmasking local access inequities.
News
Received first prize demo award in NWO ICT.OPEN conference
Open Data

Population Demographics
CTwalk Map uses the Dutch Central Bureau of Statistics (Centraal Bureau voor de Statistiek, 2020) to collect granular data on population demographics (including household location and age) at a 100 × 100 m2 grid level.
Our population demographics concern the year 2020. We group residents into three population age categories: children (0–15 years old), adolescents and adults (16–64 years old), and the elderly (equal or above 65 years of age).
Pedestrian Network
CTwalk Map uses OpenStreetMap (OSM) , an open-source mapping platform containing worldwide geographical data, to collect data on the pedestrian network.
More specifically, the OSMnx package was used to extract walkable streets, by setting the network type to “walk”. In this way, streets categories unrelated to pedestrian movement such as motorways, service roads and cycleways are excluded.
OSM data were collected in November 2021.
Places
The selection of the places to be included is influenced by Ray Oldenburg's definition of the “third places” (i.e., “public places that host the regular, voluntary, informal, and happily anticipated gatherings of individuals beyond the realms of home and work”). In other words, places where people of different ages can perform activities and socially interact with each other.
Methodology
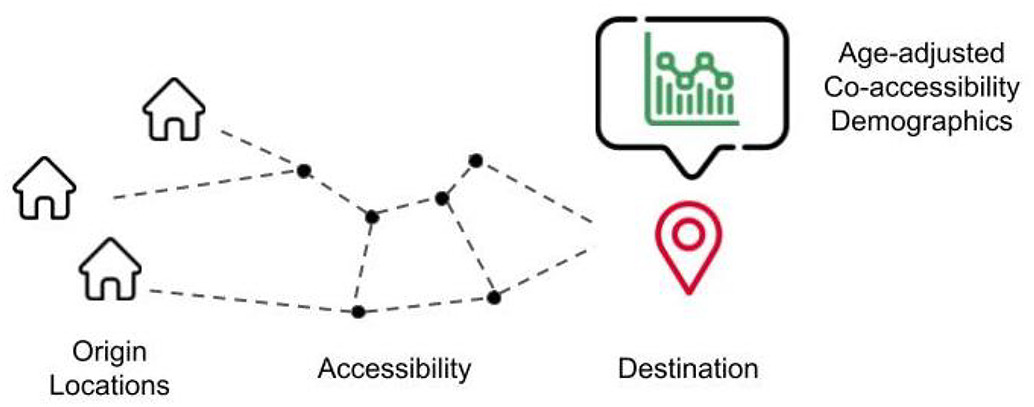
Pedestrian Accessibility
We use different walksheds to determine which places are within walking distance of each origin (i.e., homes). We employ buffers that correspond to 5- and 15-minute walking distances. We use the average walking speed of 1.26 m/s (i.e., the average of all age groups) to delineate these walksheds. Specifically:
[STEP 1] We represent the walkable street network as a graph. The edges of the graph represent streets, while the nodes represent the street intersections.
[STEP 2] We find the network node that is closest to the centroid (i.e., the geometrical center) of each grid cell. The generated node indicates a person’s estimated home location and serves as the starting point for further analysis.
[STEP 3] We measure pedestrian accessibility to various destinations by calculating walking trips from the origins, weighted by the length of each street segment, and taking into account the above-mentioned average walking speed.
[STEP 4] In this way, we compute the areas that can be reached on foot in 5 and 15-minute journeys and locate the places that are inside these areas.Co-accessibility & age diversity metric
To calculate the degree of co-accessibility and the corresponding age diversity metric for each destination:
[STEP 1] We calculate the total number of people who have access to each destination within the 5 and 15-minute walksheds.
[STEP 2] We calculate how many of these people are in each age group.
[STEP 3] We use Shannon’s Equitability Index (EI) to determine the age diversity of everyone who has access to each destination:
[STEP 4] We label each place as Low (values lower than average), Average (values around average) , or High (values higher than average), depending on the age diversity (or the number of children or elderly citizens) of the people who can access to each destination.
 The walkable street network: The walkable street network we used to calculate the walksheds from OpenStreetMap.
 Population Demographics: People's residences at a spatial resolution of 100x100m2 (CBS data).
 Places collected : Turn it on to view the places we collected from OpenStreetMap.
 ,
,  , or
, or  buttons in the upper right corner of the map will re-initialize and modify the style of the entire map.