To find out more about the methodology we used check our open-access paper HERE
How walkable is your city?
Is your neighborhood designed for pedestrians?Do you feel encouraged and safe to walk around your home?
Do the streets have too much traffic and not enough trees?
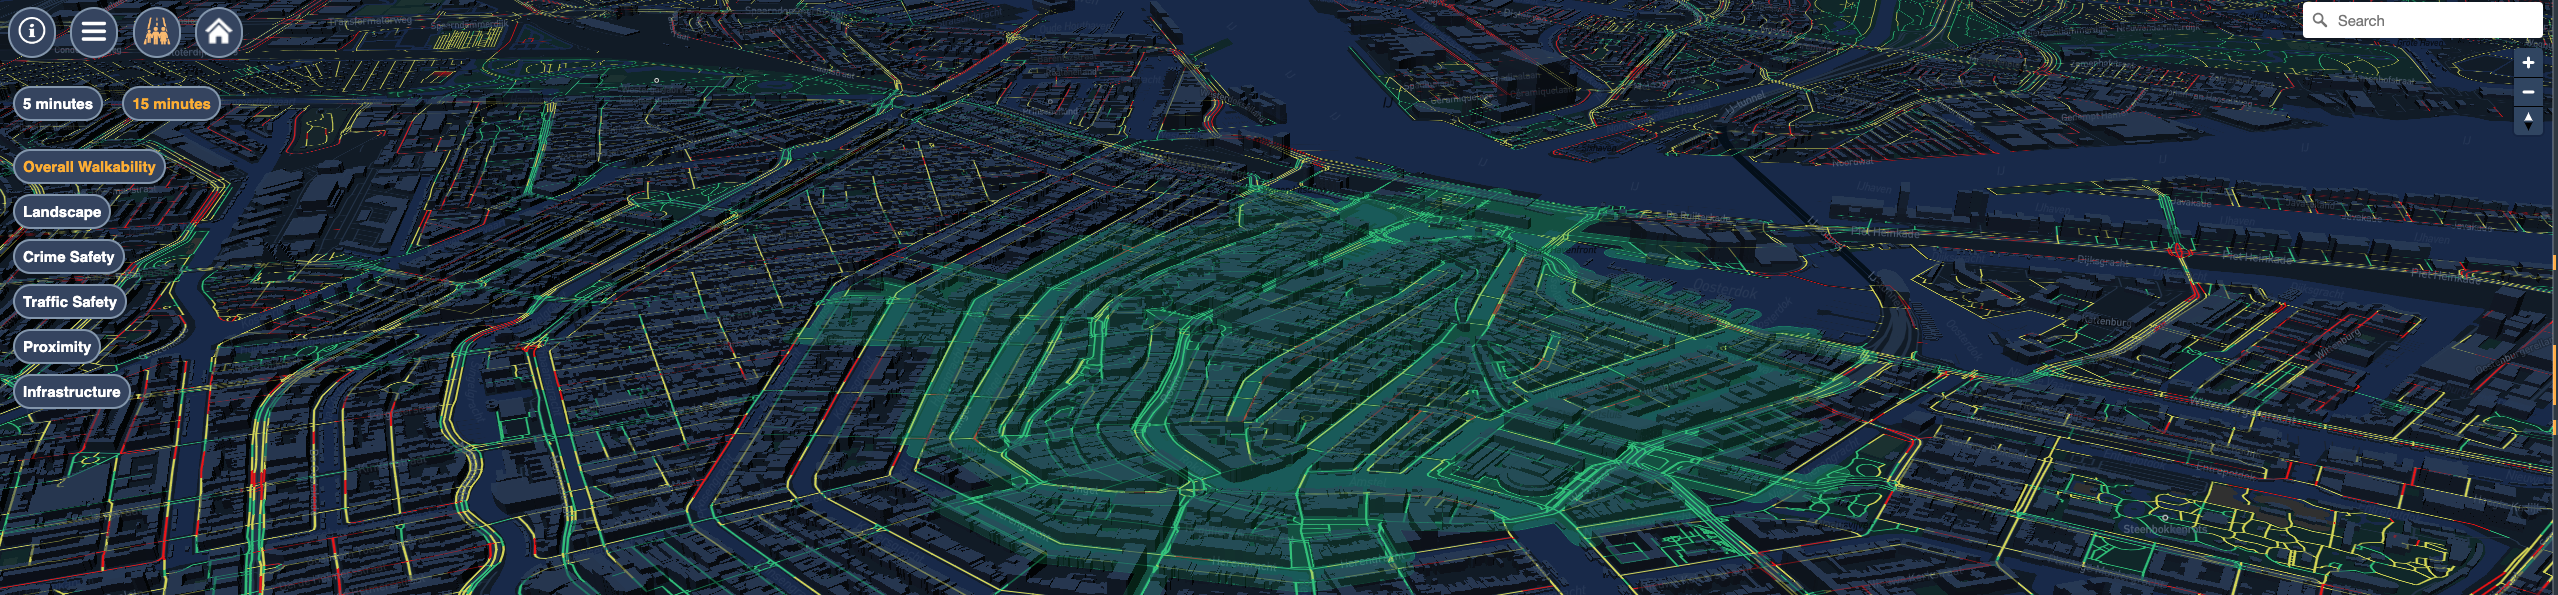
This is what the interactive CTstreets Map seeks to highlight.
- It uses granular population, location, and pedestrian network data from open sources to estimate how walkable each street is.
- It has been designed through a participatory approach involving urban experts who live and work in Amsterdam
- It estimates the degree of walkability for the 5 and 15-minute walking areas from each housing block in Amsterdam, revealing neighborhoods that encourage walking and exposing disparities in walkability.
News
🏆 The paper that showcases the work behind CTstreets won the best full paper award at the Agile2024 conference. Read it HERE
Open Data

Residential data
The Dutch Central Bureau of Statistics (Centraal Bureau voor de Statistiek, 2020) is used to collect granular residential data at a 100 × 100 m2 grid level. Our residential data concern the year 2020.
Pedestrian network, amenities, and urban furniture
OpenStreetMap (OSM) is an open-source mapping platform containing worldwide geographical data, to collect data at street level. Through the OSMnx package, we used OSM to extract walkable streets, by setting the network type to “walk”. In this way, streets categories unrelated to pedestrian movement such as motorways, service roads and cycleways are excluded. OSM data were collected in November 2021. Additionally, it was used to collect amenities and urban furniture (e.g., benches) along city streets.

Street objects and sidewalk data
The Dutch Basisregistratie Grootschalige Topografie (BGT) database is used to collect street objects and sidewalk-related data. The data from BGT claim to be accurate to within 20 centimeters and contains many details, as you see in reality. Think of trees, roads, buildings, in short: the design of the physical environment. These data concern the year 2021

Lighting, speed limits, safety, and more...
The Open data portal of the municipality of Amsterdam (AOD) , was used to retrieve data that exist explicitly for Amsterdam. These data include information about the street lighting, speed limits, crime levels, traffic safety levels, perceived safety levels, sidewalk maintenance, pedestrian areas, and parking.

From greenspaces to amenities
A variety of data were collected from the Dutch National Institute for Public Health and the Environment (RIVM)
including trees, bushes, amenities, benches, green coverage, parks, plazas, width of the sidewalk and obstacles.
Methodology
Designing a city-specific walkability index through a participatory approach
STEP 1
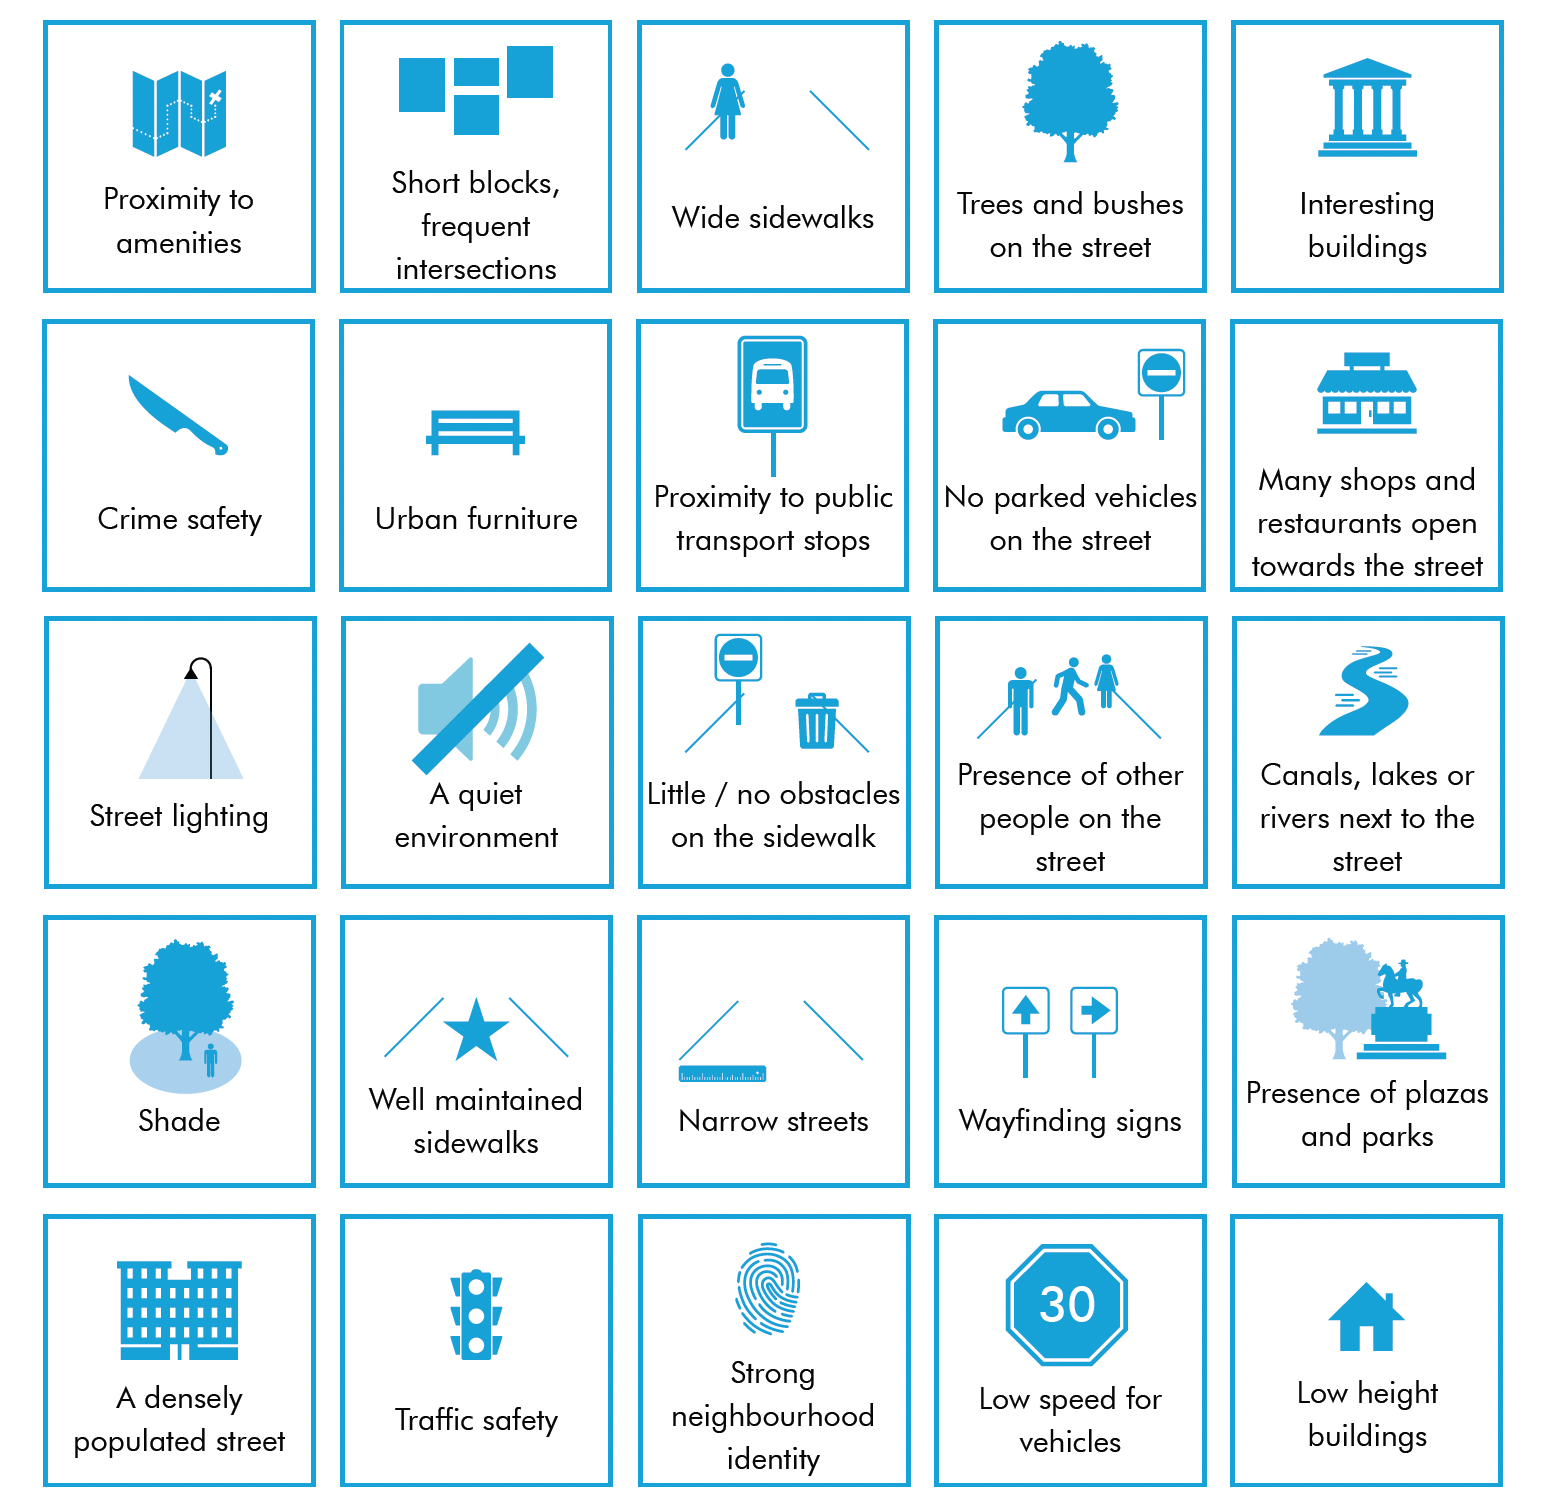
We studied the literature and made a list of all the factors that are most commonly found to impact Walkability.
STEP 2
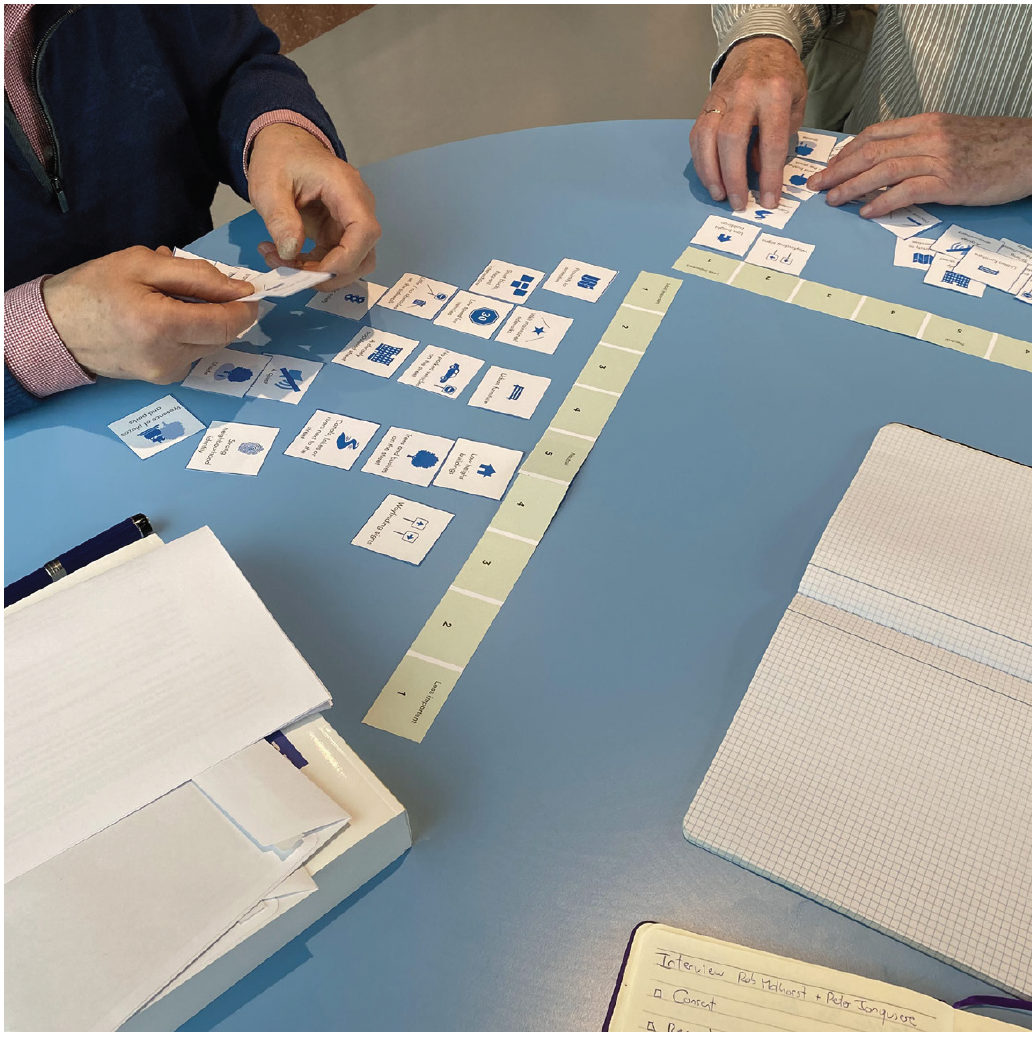
We interviewed 10 urban planners, decision-makers, and walkability advocates who work in Amsterdam, using the Q-methodology.
We asked them to prioritize the aforementioned walkability factors while considering the characteristics and citizens of Amsterdam.
STEP 3
First, we estimate the degree to which each factor affects walkability using the results of the q-methodology.
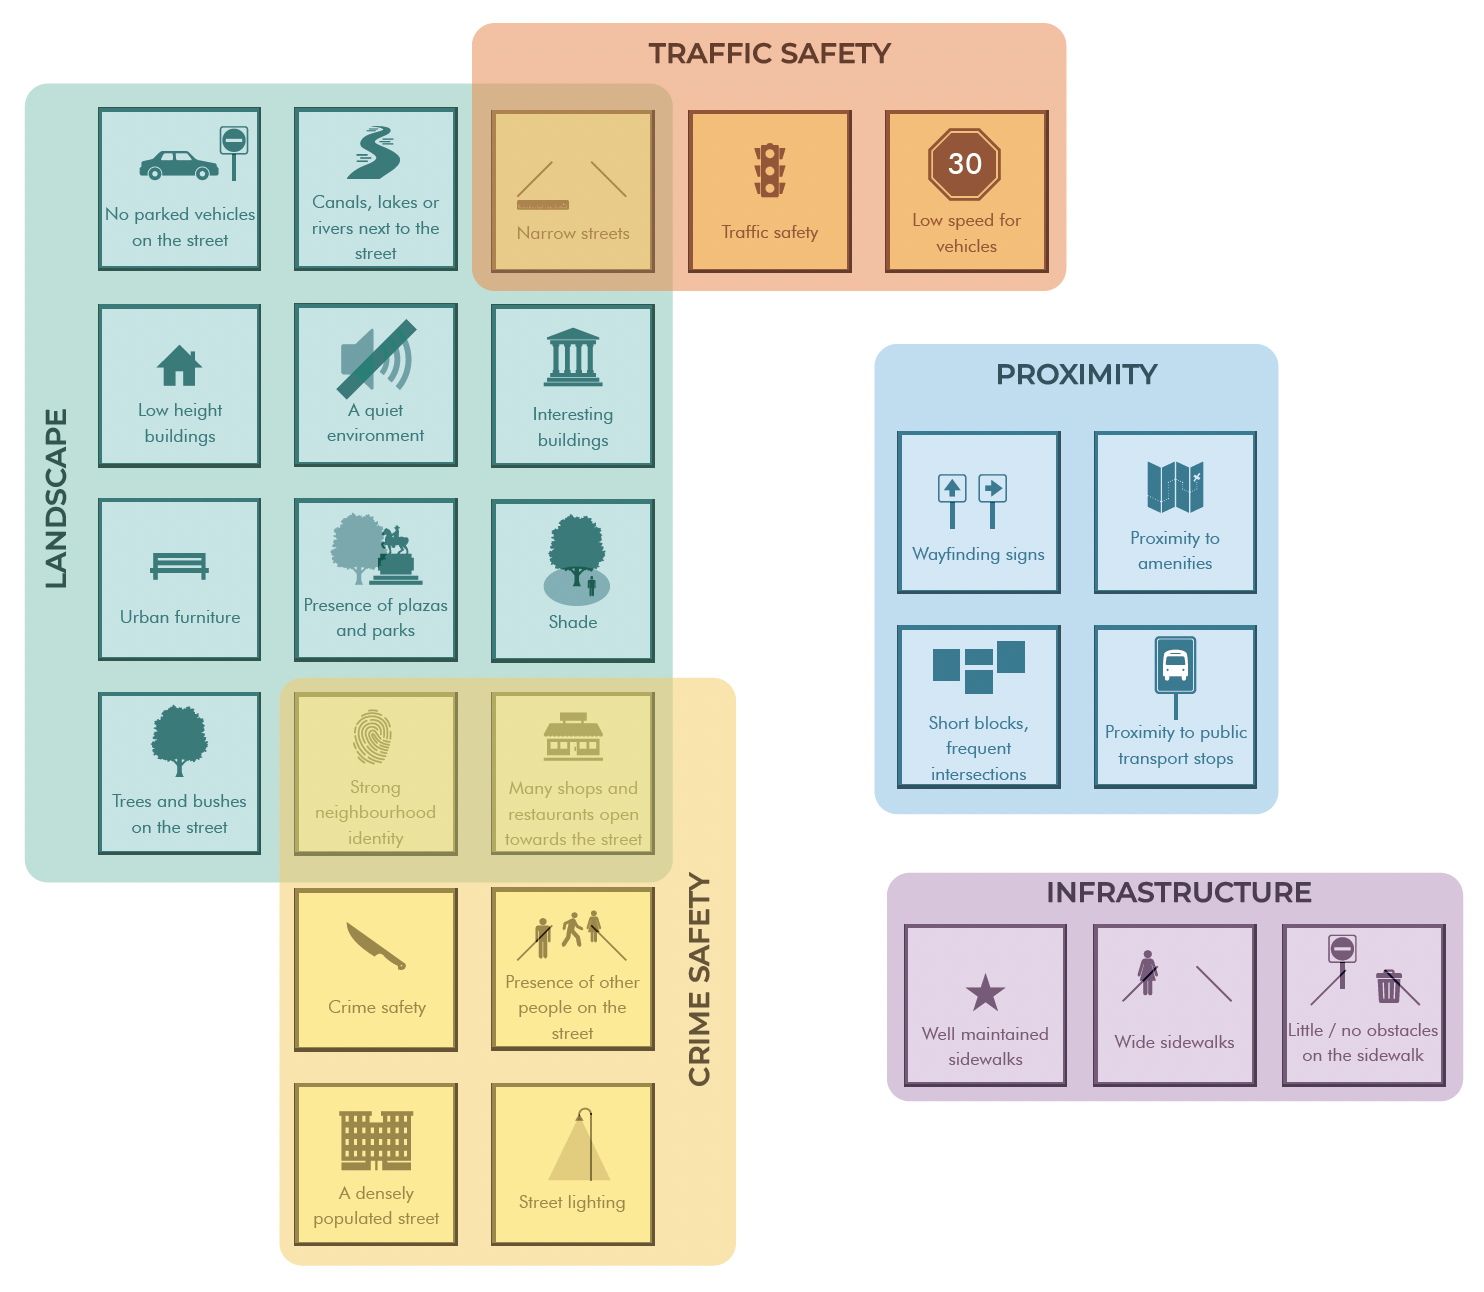
Second, we cluster our factors in themes based on the discussion with the experts (e.g., factors related to landscape, or to proximity).
Third, we create overall walkability scores, and scores per theme.
Having those scores we can finally... visualize them!
 The walkable street network: The walkable street network that shows the walkability per street.
 Residential Data: People's residences at a spatial resolution of 100x100m2 (CBS data). This shows how walkable the streets within a 5 or 15-minute walk from people's homes are.